The AIQ code based on Vitali Apirine’s article in the November issue of Stocks & Commodities, “Average Percentage True Range,” is provided at www.TradersEdgeSystems.com/traderstips.htm.
The code provided is used as an indicator (which I’ve called “PATR”). An example of the PATR is shown in Figure 7 on a chart of Apple Inc. (AAPL) compared to the same indicator on the S&P 500 index (SPX).
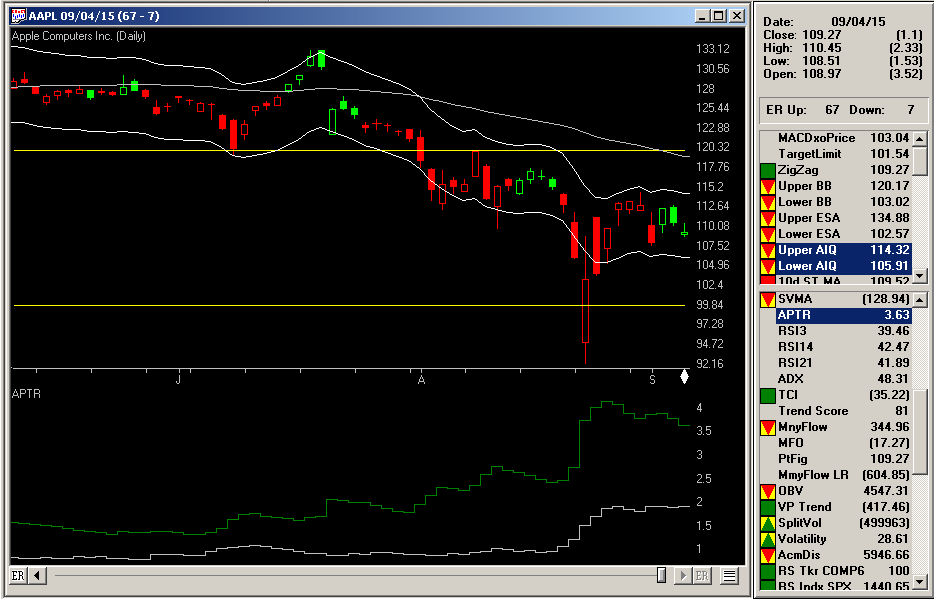
FIGURE 7: AIQ. Here is the percentage average true range (PATR) on a chart of AAPL in comparison to the same indicator plotted on the SPX index.
As mentioned, the code and EDS file can be downloaded fromwww.TradersEdgeSystems.com/traderstips.htm, and is shown below.
!AVERAGE PERCENTAGE TRUE RANGE
!Author: Vitali Apirine, TASC Nov 2015
!Coded by: Richard Denning 9/7/2015
!www.TradersEdgeSystems.com

WilderLen is 14.
Index is "SPX".
H is [high].
L is [low].
C is [close].
C1 is valresult(C,1).

LH is H - L.
HC is Abs(H - C1).
LC is abs(L - C1).

M is max(LH,HC).
MM is max(M,LC).

ATR1 is iff(MM=HC,HC,0).
MID1 is iff(ATR1>0,(valresult(C,1)+(HC/2)),0.00001).

ATR2 is iff(MM=LC and ATR1=0,LC,0).
MID2 is iff(ATR2>0,(L+(LC/2)),0.00001).

ATR3 is iff(MM=LH and ATR1=0 and ATR2=0,LH,0).
MID3 is iff(ATR3>0,(L+(LH/2)),0.00001).

ATRS is iff(ATR1>0,ATR1/MID1,iff(ATR2>0,ATR2/MID2,iff(ATR3>0,ATR3/MID3,0)))*100.

ExpLen is WilderLen*2-1.
APTR is expavg(ATRS,ExpLen). !PLOT

APTRidx is TickerUDF(Index,APTR). !PLOT

ShowValues if 1.