MACD divergence is a tried and tested technical tool. If you look at the daily price chart of Verizon below, you can clearly see the recent high on 4-12-2013. Note the MACD is well below the indicator peak back in the middle of March.

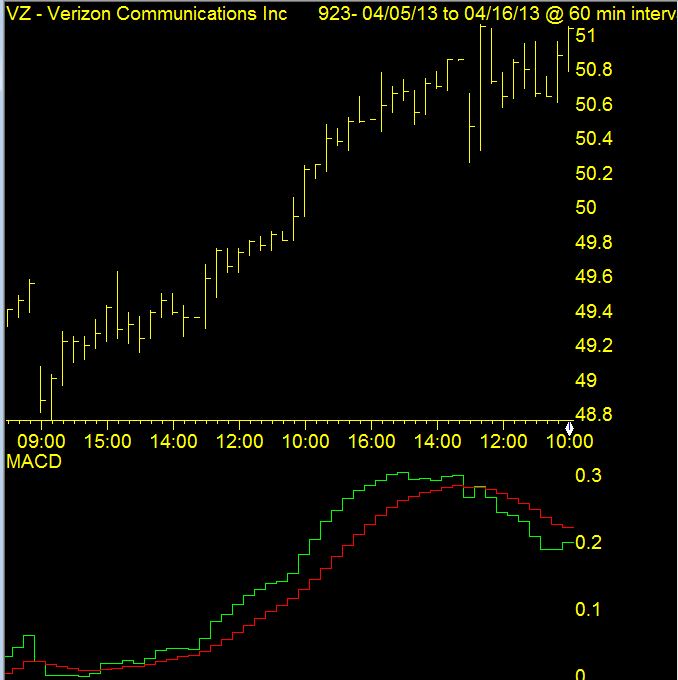
Looking at the hourly real-time chart of Verizon at the close on 4-15-2013, the same MCAD divergence characteristics are apparent.
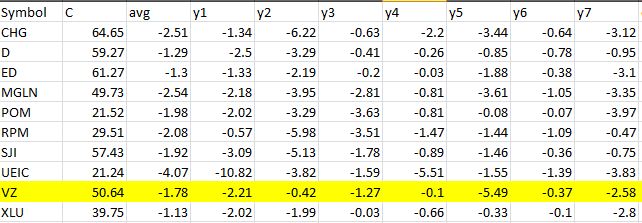
Another report that aligns nicely with this divergence is Seasonality – 5 day. Here’s a list of tickers that have exhibited down moves for this week in April for each of the last 7 years. Verizon is highlighted.