AIQ TradingExpert Pro’s Market Log provides traders with a daily snapshot of market conditions and how the market segments are performing. I’ll explain some of the elements here;
Days since the first Expert Rating to the up or down side – currently 20 days into an up rating of 100 – 0. The current rating is 33 – 33 and only ratings of 95 – 0 or 0 – 95 are significant.
Group Score is trending up vs trending down groups in S & P 500 – currently 93 % up.
WAL 13 – 87 and US 31 – 69 are a percentage measure of any stocks in the S & P 500 receiving expert ratings to the upside vs downside. Definitely more down than up ratings.
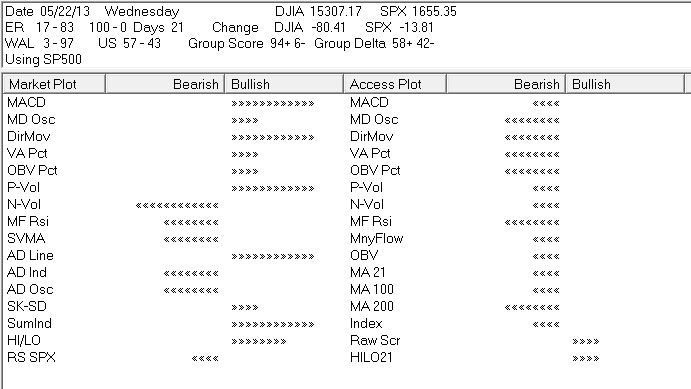
Market Plot measures the bullish and bearish readings of a basket of indicators for the Dow 30 Index.
Access Plot measures the bullish and bearish readings of a basket of indicators for each of the S & P 500 stocks. It’s the average reading for all 500 stocks for each indicator. This area I highlighted for it’s bearish technical look.
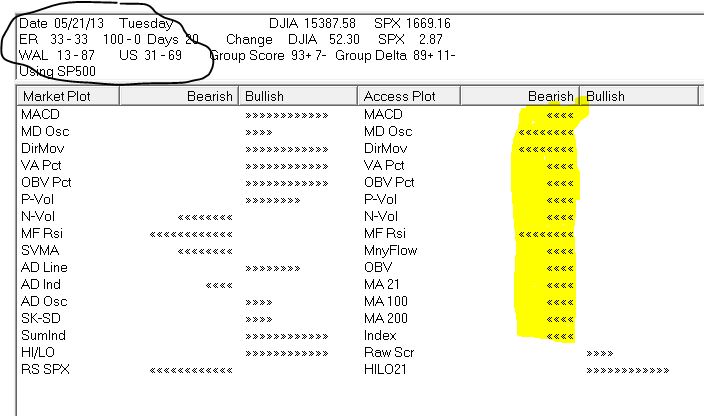
The Dow 30 Index is technically more bullish than the S & P 500 stocks. Next day Wednesday May 22nd, 2013 the Dow fell 80 some points, but the S & P 500 Index fell nearly 14 points. The market Log for 5/22/2013 shows the continued technical weakness in the stocks but less so in the Dow 30 Index.