The AIQ code for Sylvain Vervoort’s color study and system described in his article in the October issue of Stocks and Commodities, “An Expert Of A System,” is provided at www.TradersEdgeSystems.com/traderstips.htm.
Figure 1 is a chart of Netflix (NFLX) with a color bar study that shows when the expert system is in a buy mode (green bars). A buy mode occurs when the typical price exponential moving average (typEMA) is above the heinkin-ashi close exponential moving average (haEMA), and the close is above the open after having been in the sell mode. For the sell to be true (red bars), the typEMA must be below the haEMA and the close must be below the open for the initial signal to go short after having been in the buy mode.
Figure 1 also shows the two moving averages typEMA in yellow and the haEMA in green. White arrows show the signal dates for the sample trade on NFLX. The entries & exits are the next day at the open. I simplified the system and did not code the stop-loss or the breakeven exits. I ran a test on the NASDAQ 100 from August 11, 2000 to August 9, 2013.
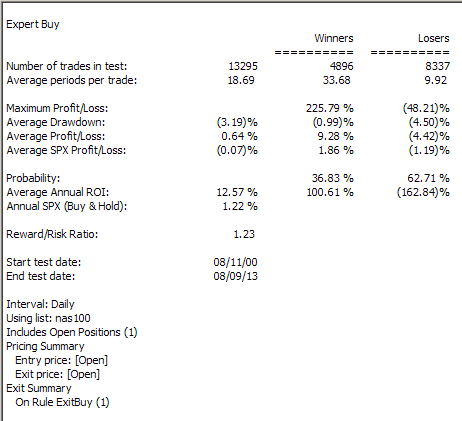
The long-side test results are summarized in Figure 2. The average return for all 13,295 trades is 0.64% per trade before commissions & slippage. This return assumes that all trades are taken. I tested the short side over this same period, and there were 13,256 trades averaging a loss of 1.00% per trade (summary not shown).
The code and EDS file can be downloaded from www.TradersEdgeSystems.com/traderstips.htm, and is shown below.
! AN EXPERT OF A SYSTEM
! Author: Sylvain Vervoort, TASC, October 2013
! Coded by: Richard Denning
! www.TradersEdgeSystems.com
! INPUTS:
H is [high].
L is [low].
C is [close].
O is [open].
OSD is offsettodate(month(),day(),year()).
typLen is 5.
haLen is 8.
!----------------HEIKIN-ASHI-----------------
haC is (O + H +L + C) / 4.
DaysInto is ReportDate() - RuleDate().
end if DaysInto >  30.
endHAO is iff(end,O, haO).
haO is (valresult(endHAO,1)
+valresult(haC,1))/2.
haH is Max(H,max(haO,haC)).
haL is Min(L,min(haO,haC)).
haCL is (haC + haO + haH + haL) / 4.
haEMA is expavg(haCL,haLen).  !PLOT
!---------------end HEIKIN-ASHI---------------
!---------------TYPICAL PRICE ----------------
TYP is (H+L+C)/3.
typEMA is expavg(TYP,typLen). !PLOT
!-----------------end TYPICAL-----------------
!--------------COLOR STUDY--------------------
G if (typEMA >  haEMA and C >  O).
Gos is scanany(G,200) then OSD.
R if typEMA <  haEMA and C <  O.
Ros is scanany(R,200) then OSD.
GREEN if G or ^Gos <  ^Ros.
RED if  R or ^Ros <  ^Gos.
!-------------end COLOR STUDY-----------------
!-------------TRADING SYSTEM------------------
Buy if G.
ExitBuy if R.
Sell if R.
ExitSell if G.
!-------------end TRADING SYSTEM--------------


