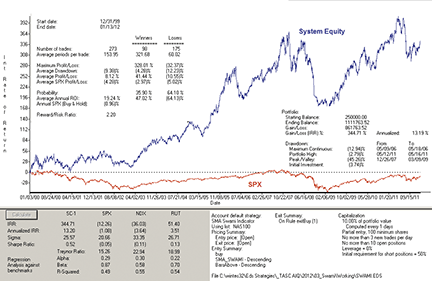
The AIQ code based on John Ehlers & Ric Way’s article in the march 2012 issue of Stocks & Comodities, “Introducing SwamiCharts,” is provided at www.TradersEdgeSystems.com/traderstips.htm.
Note that I did not attempt to replicate the SwamiCharts as displayed in Ehlers & Way’s article mainly because I am not a discretionary trader but rather focus on mechanical systems. I wanted to take the concept of multiple parameter sets for an indicator and see how this concept could be used in a trading system.
I decided to try a long-term trend-following system trading the NASDAQ 100 list of stocks using moving averages of various lengths. I created an indicator that uses five simple moving average lengths (10, 20, 50, 100, 200). If the close is above the moving average, then it gets a value of +1; otherwise, it gets a value of -1. I then simply sum the five values from the different lengths to create the SMA_SWAMI indicator. I then created a system with the indicator by entering long when the indicator is greater than or equal to 4 and exit when it drops to less than -4. I didn’t test the short side of the system, only the buy side. The code to test the short side is provided but was not tested.

!Authors: John Ehlers and Ric Way, TASC March 2012
!System author: Richard Denning 1/15/2012
!Coded by: Richard Denning 1/15/2012
!www.TradersEdgeSystems.com
!INPUTS:
buyLvl is 4.
exitBuyLvl is -4.
sellLvl is -3.
exitSellLvl is 0.
C is [close].
sma10 is simpleavg(C,10).
sma20 is simpleavg(C,20).
sma50 is simpleavg(C,50).
sma100 is simpleavg(C,100).
sma200 is simpleavg(C,200).
sig10 is iff(C > sma10,1,-1).
sig20 is iff(C > sma20,1,-1).
sig50 is iff(C > sma50,1,-1).
sig100 is iff(C > sma100,1,-1).
sig200 is iff(C > sma200,1,-1).
SMA_SWAMI is sig10 + sig20 + sig50 + sig100 + sig200.
BarsAbove is countof(C > sma10,20).
buy if SMA_SWAMI >= buyLvl and valrule(SMA_SWAMI < buyLvl,1).
exitBuy if SMA_SWAMI < exitBuyLvl.
sell if SMA_SWAMI <= sellLvl.
exitSell if SMA_SWAMI > exitSellLvl.
This email address is being protected from spambots. You need JavaScript enabled to view it.
for AIQ Systems

