The ever changing landscape in computer technology hardware makes for a rough ride for some tech stocks. Take a look at this one year comparison chart of the S & P 500 Computer Hardware Group (yellow). The display shows the percentage change starting from one year ago. It’s down 3-4 %.
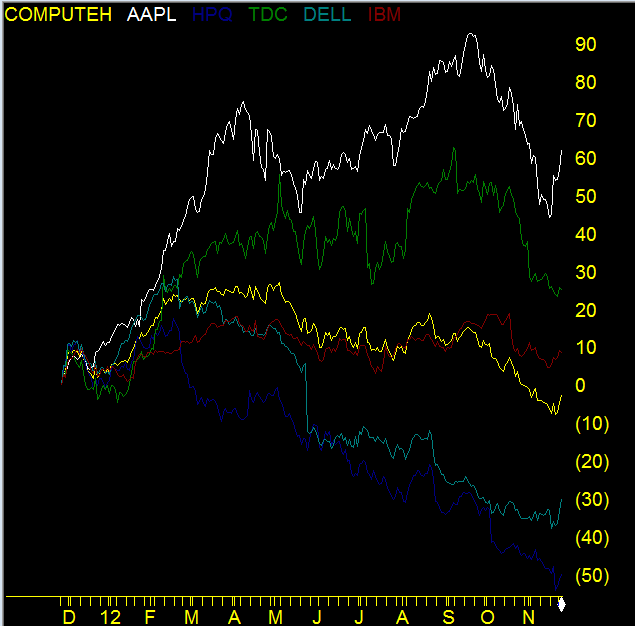
The component stocks tell a mixed tale. Apple (white) despite the recent pullback is still up over 60% from a year ago. Terradata (green) is also fairing well up around 25% and even IBM (red) is up near 10%. IBM and Terradata make a a good deal of profit from non-hardware sources.
The reason the group is down overall is a reflection of the poor performance of the 2 heavyweight PC goliaths, Dell and Hewlett Packard. Dell (light green) is down nearly 30% and HPQ (blue) down 50%. The 2 year comparison chart (not displayed here) shows HPQ down 70%, as the worse performer, with AAPL up 90% as the best performer in the group.