Well the stock market just seems to keep chugging along. Despite the shaky economy, the national debt, the political discord, the terrorists on the march and the price of – well, just about everything made in China. And as a dutiful trend-follower I continue to “ride the ride” all the while repeating the ever apt phrase, “What, me worry?”
Three things for the record:
1) The stock market is in a clearly established uptrend and who am I to say otherwise?
2) Personally I still expect a serious “something” between now and the end of September
3) Arguably the most important bullish seasonal trend of all kicks in at the close on September 30, 2014.
Huh?
Yes folks, as of the close on September 30th it will be time for “the Mid Decade Rally”
Defining the Mid-Decade Rally
For the purposes of this article we will break each decade into two periods:
*Period 1 (i.e., the “Bullish 18″) = the 18 months extending from the end of September of Year “4” (2014, 2004, 1994, etc.)
*Period 2 (i.e., the “Other 102″) = the other 102 months of every decade.
So in a nutshell, Period 1 comprises 15% of each decade while Period 2 comprises 85% of each decade. Given that Period 2 is 5.67 times as long as Period 1 it would seem likely that an investor would make more money being in the stock market during Period 2 than during Period 1.
I mean if you had to choose – particularly given the long-term overall upward bias of the stock market – would you choose to be in the market 85% of the time or only 15% of the time. Safe to say most investors would answer the former. But if you are among those who chose this answer, perhaps you should read a little further.
Period 1: The “Bullish 18 Months” of the Decade
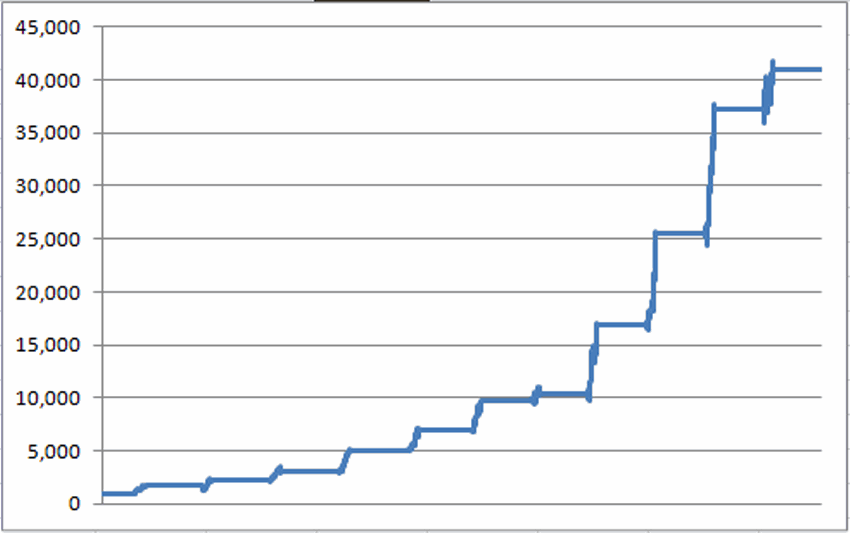
In Figure 1 you see the growth of $1,000 invested in the Dow Jones Industrials Average only during the middle 18 months (Sep. 30, Year 4 through Mar. 31, Year 6) of every decade starting in 1900. See if anything at all jumps out at you from the chart.
Does the word “consistency” come to mind? For the record, $1,000 invested only during this 18-month period grew to $40,948, or +3,994%. Now this all looks and sounds pretty good, but surely an investor would have made a lot more money investing in the stock market during the other 102 months of each decade, right? Well, not exactly. In fact, a more accurate statement might be, “not at all.”
Period 2: The “Other 102” Months of the Decade
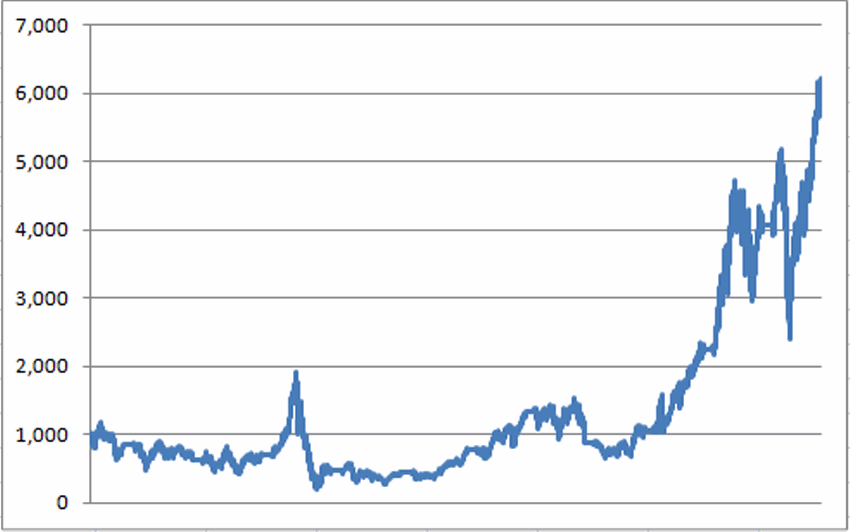
Figure 2 displays the growth of $1,000 invested in the Dow Jones Industrials Average only during the other 102 months of each decade. $1,000 invested in the market 85% of the time – but excluding the mid-decade bullish period – would have grown to $6,166, or +517%.
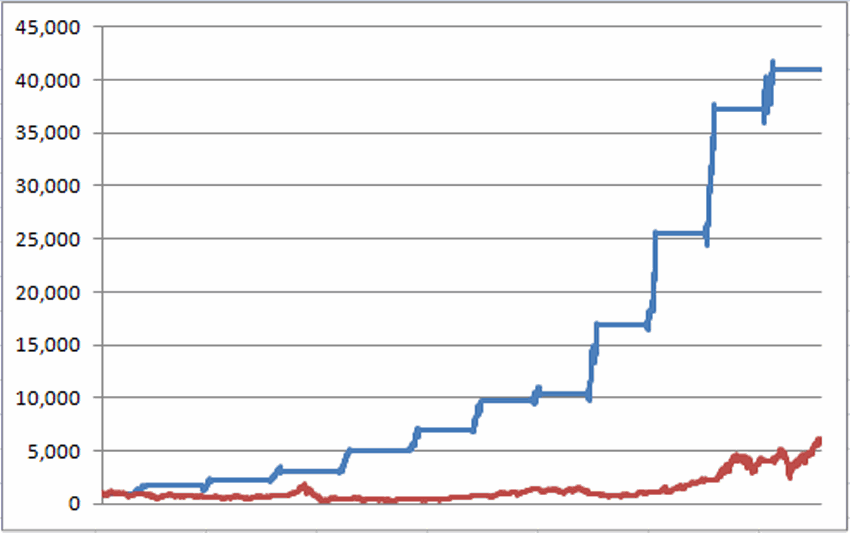
Now for the record, +517% is +517% and no one is saying that you should simply mechanically sit out the 102 “other” months. But the point is simply that the “Bullish 18” made 7.73 times as much money – while invested only 15% of the time – as the “Other 102” – which was invested in stocks 85% of the time.
The difference is even clearer when the two lines are drawn on the same chart as shown in Figure 3.
Mid Decade “Bullish 18” Performance
| Period | % +(-) during “Bullish 18” |
| 9/30/1904-3/31/1906 | +68.3% |
| 9/30/1914-3/31/1906 | +30.6% |
| 9/30/1924-3/31/1906 | +36.2% |
| 9/30/1934-3/31/1906 | +68.8% |
| 9/30/1944-3/31/1906 | +36.1% |
| 9/30/1954-3/31/1906 | +42.0% |
| 9/30/1964-3/31/1906 | +5.6% |
| 9/30/1974-3/31/1906 | +64.4% |
| 9/30/1984-3/31/1906 | +50.7% |
| 9/30/1994-3/31/1906 | +45.4% |
| 9/30/2004-3/31/1906 | +10.2% |
For the record:
*The average % gain for the Bullish 18 was +41.7%
*The median % gain for the Bullish 18 was +42.5%
On the other hand:
*The average % gain for the Other 102 was +34.3%
*The median % gain for the Bullish 18 was -2.2%
So you see why I am marking September 30, 2014 on my calendar.
By the way, if you like this one, in the immortal words of Jimmy Durante, “I got a million of ‘em.”
Jay Kaeppel
Chief Market Analyst at JayOnTheMarkets.com and AIQ TradingExpert Pro (http://www.aiq.com) client


