Alright, first the Bad News: A) The trend I am going to discuss is not necessarily “timely”, and B) technically, one could say that it is “not working” at this exact moment in time. The Good News is that on a rolling five-year return basis, this trend has yet to show a loss (at least not since I started tracking Fidelity Select Construction & Housing (ticker FSHOX) in 1988.
Bullish Period versus Bearish Period
*The “bullish” period for housing stocks (using FSHOX as a proxy) begins at the close of trading on October Trading Day #7 and extends through the end of the 2nd trading day the following June.
*The “bearish” period for housing stocks (using FSHOX as a proxy) begins at the close of trading on the 2nd trading day of June and extends through the end of the 7th trading day in October.
The Periods at a Glance
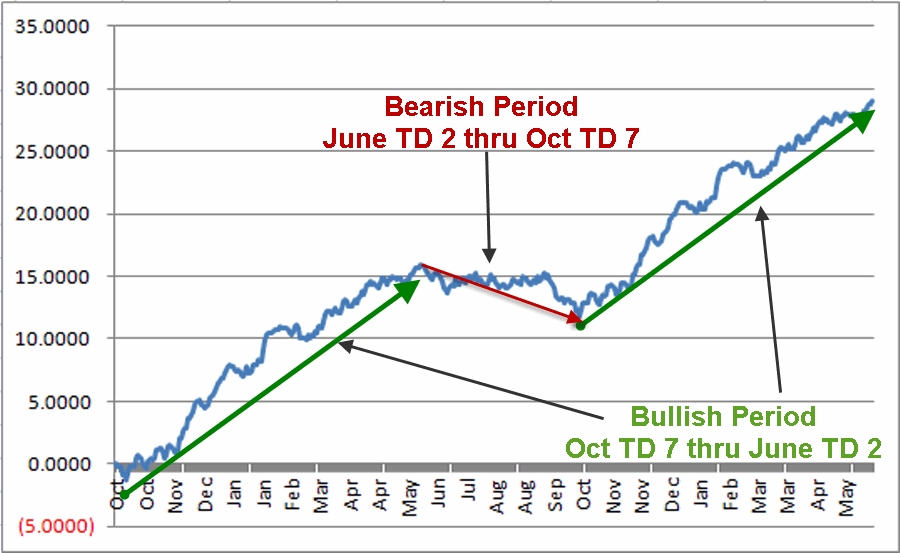
Figure 1 displays the annual seasonal chart for FSHOX. As you can see, the tendency has been to stage a strong advance during the so-called “bullish” period and to lose ground during the so-called bearish period. Figure 1 – FSHOX Seasonal Pattern
 Figure 1 – FSHOX Seasonal Pattern
To illustrate the difference in performance more clearly, Figure 2 displays the growth of $1,000 invested in FSHOX only during the bullish period every year since December 1988. To date, $1,000 has grown to $60,159 (+5,916%). That’s the good news. The bad news is that since 10/9/15 FSHOX is down -11.6%. Figure 2 – FSHOX performance during “Bullish” periods (12/1988-present)
 Figure 2 – FSHOX performance during “Bullish” periods (12/1988-present)
Figure 3 displays the growth of $1,000 invested in FSHOX only during the bearish period every year since December 1988. To date, $1,000 has declined in value to $316 (-68%). Figure 3 – FSHOX performance during “Bearish” periods (12/1988-present)
 Figure 3 – FSHOX performance during “Bearish” periods (12/1988-present)
As you can see in Figure 3 it is not as though FSHOX declines each and every year during the “bearish” period. Still, a gain of +5,915% for the bullish periods versus a loss of -68% for the bearish periods is what we “quantitative types” refer to as “statistically significant”.
Long-Term Perspective: 5-Year Rolling Returns
Figure 4 starts at the end of 1993 and shows the total return over the previous 5-years for both bullish and bearish seasonal periods using FSHOX.
Figure 4 – 5-Yr. % return for Bullish Periods (Blue) versus Bearish Periods (Red)
There are two key things to note from Figure 4:
*The “bullish” period for FSHOX has gained ground over a 5-year period 100% of the time
*The “bullish” period for FSHOX has outperformed the “bearish” period over a 5-year period 100% of the time
Other figures to note:
*The median 5-year gain for the “bullish” period is +118.4%
*The median 5-year loss for the “bearish” period is (-19.1%)
*The “bullish” period has showed a 5-year gain 100% of the time
*The “bearish” period has show a 5-year gain only 17.4% of the time
One Precedent of Interest
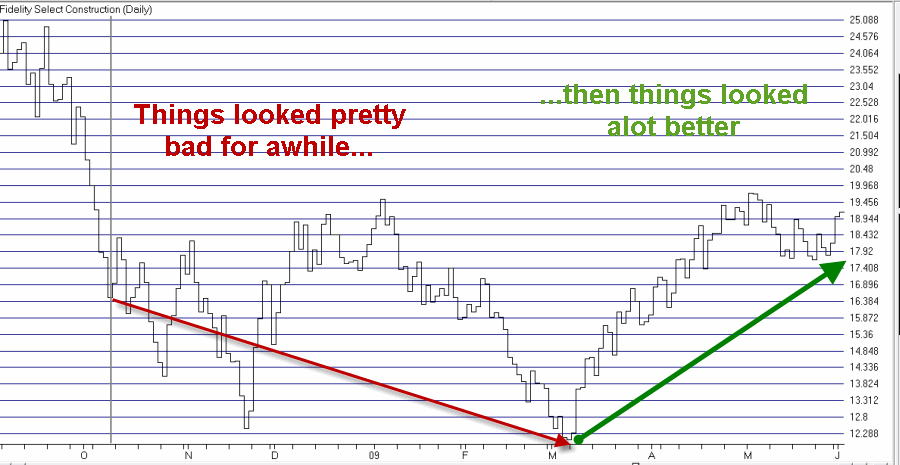
The October 2008-June 2009 period is shown in Figure 5. Figure 5 – FSHOX 2008-2009 Bullish Period (Courtesy AIQ TradingExpert)
 Figure 5 – FSHOX 2008-2009 Bullish Period (Courtesy AIQ TradingExpert)
Figure 6 – FSHOX 2015-2016 Bullish Period (so far) (Courtesy AIQ TradingExpert)
Summary
The tendency for housing and construction stocks to outperform between early October and early June (in a significant way) is one of the more persistent seasonal trends ?I have seen. That’s the Good News.
The Bad News is that this trend isn’t doing anybody any good this time around (with FSHOX down -11.6% since October 9th). So that leads to one of two possibilities:
*Housing and construction stocks are just having not able to perform in the current market environment, or;
*Housing and construction stocks may be poised for a decent advance between now and June.
If we are in fact on the brink of a worldwide economic meltdown then there isn’t much chances that building stocks are going to look too good. But if not – and certainly from a contrarian point of view – then these stocks may be worth a look.
Jay Kaeppel
Chief Market Analyst at JayOnTheMarkets.com and AIQ TradingExpert Pro (http://www.aiq.com) client


