Don’t you just hate titles like this one? I mean if you are into the stock market you almost can’t help but to click on it – even if for no other reason than to seek the answer to that age old question, “What’s the catch?”
Now in this case the title is accurate, at least in the hypothetical sense. But as you probably know, for any book, article or publication the name is everything. For example, if the title of this article were “Would You Be Willing to Risk $3,000 on a Trade for the Chance of Making as Little as $25 on Said Trade?” (which would also be hypothetically accurate), you would be a lot less likely to click on the link, right? I mean let’s be honest here.
So, yes, technically you can’t judge a book (article or publication) by its cover. But in reality, we all do it all the time. So just remember that the people designing the covers have a vested interest in getting you to open the cover, so be forewarned.
Hence the title of this article. But since you’ve already “cracked open the cover”, why not read on a little further? (Insidious, no?)
A Seasonal Oversold “Idea”
Note the use of the word “Idea” in the section title. And also please remember that the word “idea” is quite different from the words “sure” and/or “thing” and way different from the phrase “you can’t lose.” So again, be forewarned. In the interest of full disclosure I am not attempting to urge you to use the “idea” spelled out below – only to be “aware” of it and to consider whether or not it might “fit your style.”
So what’s this all about? Simple. Awhile back I wrote a piece titled “Happy Days are Here, Um, Next Monday?” that in a nutshell highlighted the fact that the stock market tends to perform well between the close of trading on the Friday before Thanksgiving and the close of the third trading day of the following January. The “idea” in this article builds from that trend.
Entry Rules
Here are the “rules” (to paraphrase the immortal words of Bill Murray, they are really “guidelines” more than “rules”, but here goes):
*If today is between (and including) the Friday before Thanksgiving and the third trading day of the New Year, AND;
*The 2-day RSI is below 30, a “buy alert” is signaled.
*After a “buy alert” occurs, a “buy signal” occurs when the E-mini S&P 500 exceeds a previous day’s high price (however, a “buy signal” cannot occur after the third trading day of January).
Exit Rules (OK, again – Guidelines):
*Sell if the E-mini S&P declines 60 (i.e., $3,000 per contract) points from the buy trigger price (i.e., the previous day’s high + 0.25 points), OR
*On the first profitable close.
Results
Starting in November 2004 there have been 42 trades. During this time there have been no post buy declines of 60 points (although a few have come close), hence the reason no losing trades.
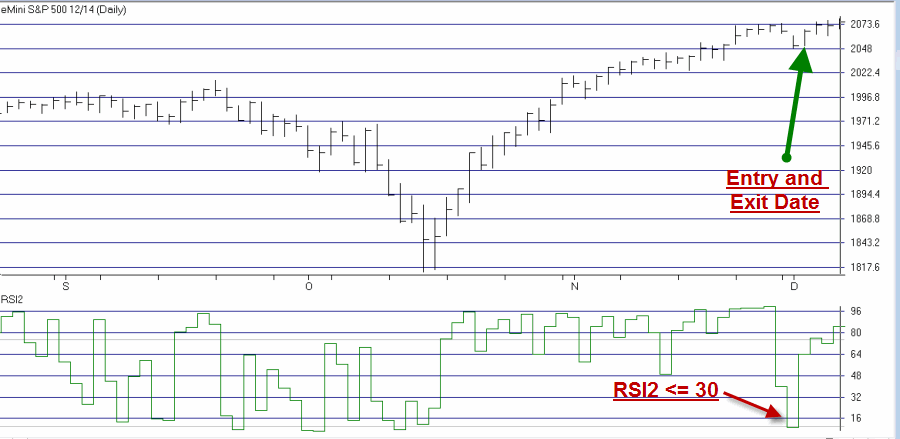
Figure 1 displays the most recent signal using the December 2014 E-mini S&P 500 contract.
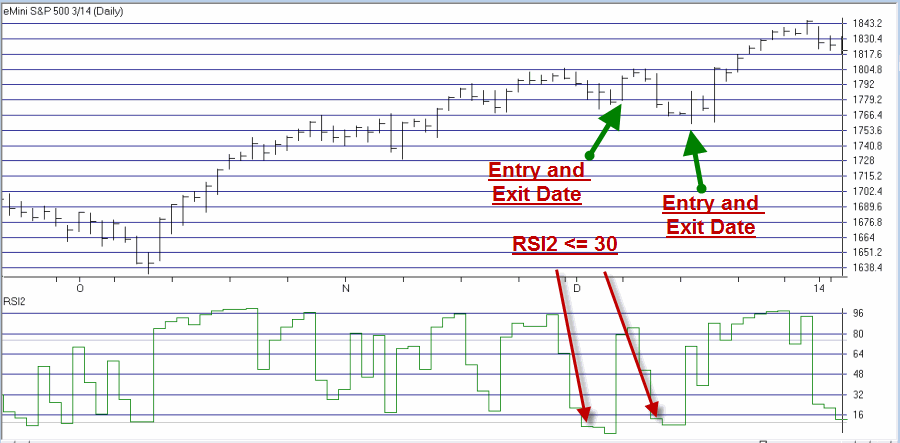
Figure 2 displays the trades from the 2013-2014 periods.
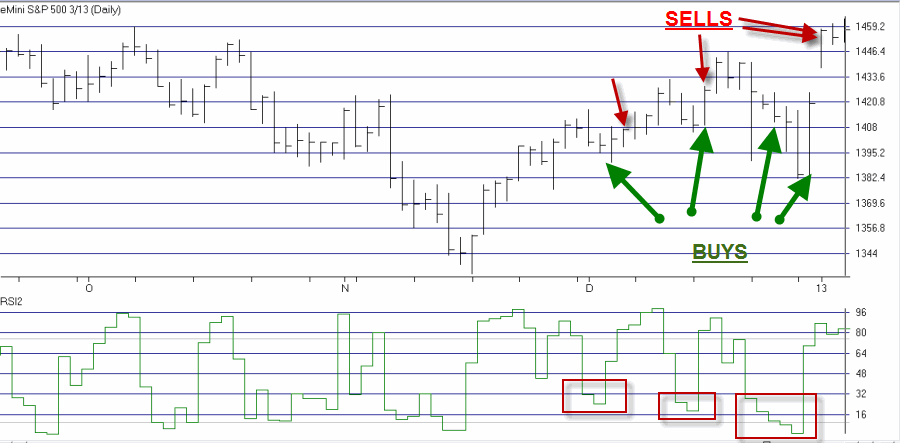
Figure 3 displays the trades from the 2012-2013 periods.
Figure 4 displays the trades signaled each year during the bullish seasonal period (assuming a 1-lot per trade).
| Trade # | Entry Date | Exit Date | Buy Price | Sell Price | Points +(-) per Trade | $ +(-) per Trade | MaxDD Pts. per Trade | MaxDD $ per Trade |
| 1 | 11/23/04 | 11/24/04 | 1179.25 | 1182.00 | 2.75 | $137.50 | (7.75) | ($388) |
| 2 | 12/01/04 | 12/01/04 | 1179.75 | 1189.75 | 10.00 | $500.00 | (4.75) | ($238) |
| 3 | 12/09/04 | 12/09/04 | 1187.00 | 1190.75 | 3.75 | $187.50 | (11.25) | ($563) |
| 4 | 12/20/04 | 12/21/14 | 1203.75 | 1208.00 | 4.25 | $212.50 | (8.50) | ($425) |
| 5 | 12/01/05 | 12/01/05 | 1263.25 | 1264.50 | 1.25 | $62.50 | (11.50) | ($575) |
| 6 | 12/12/05 | 12/13/05 | 1272.75 | 1277.00 | 4.25 | $212.50 | (9.00) | ($450) |
| 7 | 12/21/05 | 12/22/05 | 1272.25 | 1275.50 | 3.25 | $162.50 | (5.50) | ($275) |
| 8 | 01/03/06 | 01/03/06 | 1259.25 | 1274.75 | 15.50 | $775.00 | (7.75) | ($388) |
| 9 | 11/29/06 | 11/29/06 | 1392.75 | 1402.25 | 9.50 | $475.00 | (0.50) | ($25) |
| 10 | 12/11/06 | 12/14/07 | 1428.00 | 1438.25 | 10.25 | $512.50 | (11.00) | ($550) |
| 11 | 12/27/06 | 12/27/06 | 1431.25 | 1437.00 | 5.75 | $287.50 | (0.25) | ($13) |
| 12 | 11/23/07 | 11/28/07 | 1440.00 | 1442.00 | 2.00 | $100.00 | (33.25) | ($1,663) |
| 13 | 11/26/07 | 11/28/07 | 1444.25 | 1470.50 | 26.25 | $1,312.50 | (37.50) | ($1,875) |
| 14 | 11/28/07 | 11/28/07 | 1441.25 | 1470.50 | 29.25 | $1,462.50 | (0.25) | ($13) |
| 15 | 12/05/07 | 12/05/07 | 1478.00 | 1487.00 | 9.00 | $450.00 | (1.25) | ($63) |
| 16 | 12/19/07 | 12/20/07 | 1471.75 | 1474.75 | 3.00 | $150.00 | (16.00) | ($800) |
| 17 | 11/24/08 | 11/24/08 | 814.50 | 848.00 | 33.50 | $1,675.00 | (7.25) | ($363) |
| 18 | 12/03/08 | 12/03/08 | 851.00 | 868.50 | 17.50 | $875.00 | (24.75) | ($1,238) |
| 19 | 12/16/08 | 12/16/08 | 885.50 | 912.75 | 27.25 | $1,362.50 | (9.75) | ($488) |
| 20 | 12/26/08 | 12/29/08 | 870.00 | 870.50 | 0.50 | $25.00 | (16.75) | ($838) |
| 21 | 11/23/09 | 11/23/09 | 1102.50 | 1103.75 | 1.25 | $62.50 | (1.25) | ($63) |
| 22 | 12/01/09 | 12/01/09 | 1104.75 | 1108.50 | 3.75 | $187.50 | (2.50) | ($125) |
| 23 | 12/04/09 | 12/22/09 | 1112.25 | 1113.50 | 1.25 | $62.50 | (3.75) | ($188) |
| 24 | 12/10/09 | 12/11/09 | 1097.75 | 1103.25 | 5.50 | $275.00 | (5.25) | ($263) |
| 25 | 12/21/09 | 12/22/09 | 1107.75 | 1108.25 | 0.50 | $25.00 | (11.25) | ($563) |
| 26 | 01/04/10 | 01/04/10 | 1124.25 | 1128.75 | 4.50 | $225.00 | (4.75) | ($238) |
| 27 | 11/24/10 | 12/01/10 | 1187.75 | 1196.50 | 8.75 | $437.50 | (11.50) | ($575) |
| 28 | 12/01/10 | 12/01/10 | 1197.50 | 1204.50 | 7.00 | $350.00 | (0.50) | ($25) |
| 29 | 12/16/10 | 12/21/10 | 1244.50 | 1250.75 | 6.25 | $312.50 | (12.00) | ($600) |
| 30 | 01/03/11 | 01/03/11 | 1258.50 | 1265.25 | 6.75 | $337.50 | (3.25) | ($163) |
| 31 | 11/28/11 | 11/28/11 | 1174.50 | 1191.00 | 16.50 | $825.00 | (5.25) | ($263) |
| 32 | 12/09/11 | 12/09/11 | 1250.50 | 1253.00 | 2.50 | $125.00 | (17.75) | ($888) |
| 33 | 12/15/11 | 12/20/11 | 1218.75 | 1236.00 | 17.25 | $862.50 | (23.25) | ($1,163) |
| 34 | 12/20/11 | 12/20/11 | 1218.75 | 1236.00 | 17.25 | $862.50 | (20.00) | ($1,000) |
| 35 | 12/30/11 | 01/03/12 | 1258.75 | 1272.00 | 13.25 | $662.50 | (8.00) | ($400) |
| 36 | 12/05/12 | 12/06/12 | 1412.00 | 1413.00 | 1.00 | $50.00 | (15.25) | ($763) |
| 37 | 12/17/12 | 12/17/12 | 1419.50 | 1427.00 | 7.50 | $375.00 | (10.25) | ($513) |
| 38 | 12/26/12 | 01/02/13 | 1424.75 | 1457.00 | 32.25 | $1,612.50 | (42.50) | ($2,125) |
| 39 | 12/31/12 | 12/31/12 | 1417.00 | 1420.00 | 3.00 | $150.00 | (33.50) | ($1,675) |
| 40 | 12/06/13 | 12/06/13 | 1794.50 | 1803.75 | 9.25 | $462.50 | (8.75) | ($438) |
| 41 | 12/16/13 | 12/16/13 | 1783.25 | 1786.00 | 2.75 | $137.50 | (17.75) | ($888) |
| 42 | 12/02/14 | 12/02/14 | 2061.25 | 2066.00 | 4.75 | $237.50 | (10.50) | ($525) |
| Points | $ | Points | $ | |||||
| Average | 9.32 | $466 | (11.74) | ($587) | ||||
| Median | 6.00 | $300 | (9.38) | ($469) | ||||
| Max | 33.50 | $1,675 | (0.25) | ($13) | ||||
| Min | 0.50 | $25 | (42.50) | ($2,125) |
A few things to note:
*42 winners, 0 losers
*Maximum drawdown per 1-lot = -$2,125
*Average winner in points (dollars) = +9.32 (+$466)
*Median winner in points (dollars) = +6.00 ($300)
*Average Maximum drawdown per trade in points (dollars) = -11.74 (-$587)
*Median Maximum drawdown per trade in points (dollars) = -9.38 (-$469)
Summary
So on the face of it, anything that is capable of generating 42 consecutive winning trades would seem to have some merit to it. On the other hand, with any trading method it is critically important to look “under the hood” and make some realistic assessments regarding the actual usefulness of said method.
The system rules include a 60 point stop-loss for the E-mini S&P 500 futures contract. At $50 a point, this equates to a potential loss of $3,000 per contract per trade. The average dollar profit was only $466 and the median dollar profit per trade was $300.
The key elements of risk in this method then are:
1) One losing trade of $3,000 could require a number of trades to come back from.
2) Using a tight stop-loss will result in a number of losing trades that would ultimately have ended up winners.
So the question for a trader to ask is – can we judge this book by its cover?
Jay Kaeppel
Chief Market Analyst at JayOnTheMarkets.com and AIQ TradingExpert Pro (http://www.aiq.com) client
http://jayonthemarkets.com/


