When the market is falling and the charts look terrible, your emotions want you to sell. Conversely, when the market is rallying and the news is good, your emotions want you to buy. Unfortunately, this can lead to selling at the low or buying at the high. One way of controlling your emotions is to set some market timing rules based on AIQ’s US score, a unique indicator that can be found on the Market Log report.
While the Expert Ratings on an individual stock can be suspect, the Expert Ratings taken from a large database of stocks are more effective in classifying the health of the market. That is, when a lot of stocks are giving AIQ Expert Rating buy signals, a market rally may be near. Conversely, when a large number of stocks are giving AIQ sell signals, a market decline may be approaching. Expert Ratings are either confirmed” or “unconfirmed.” A confirmed buy signal occurs when a stock has a recent Expert Rating up signal of 95 or greater along with an increasing Phase indicator. The opposite is true for confirmed sell signals. Unconfirmed signals, however, occur when there is an Expert Rating of 95 or greater but the Phase indicator fails to move in the direction of the signal. It is the unconfirmed signals that you should be interested in.
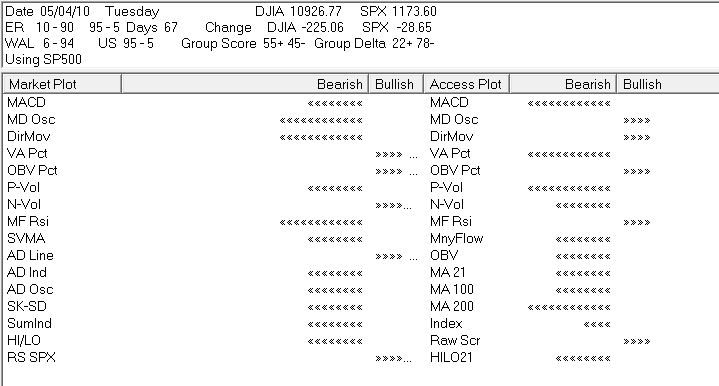
AIQ’s Market Log report lists the percentage of stocks giving unconfirmed signals (US). The US score is found near the top of the report (Figure 1). The percentage of stocks giving unconfirmed AIQ buy signals appears to the left of the hyphen and the percentage of stocks giving unconfirmed AIQ sell signals appears on the right side of the hyphen. In the image below we see that of the stocks giving unconfirmed signals, 95% are on the buy side and 5% are on the sell side. To open the Market Log report, go to Reports and double-click Summary Reports and then Market Log. I run the Market Log report on the S&P 500 database.
It is important to keep in mind that AIQ Expert Ratings fire against the trend. As the market declines, the percentage of stocks giving unconfirmed AIQ buy signals increases. As the market rallies, few stocks give buy signals and more stocks register sell signals.
The US score serves as an overbought/oversold indicator for the market. That is, when the US score 85% or more on the buy side, then that implies the market has recently experienced a sharp decline, is oversold, and due for a rally. Conversely, when the US score shows 85% or more on the sell side, then the market has rallied and is overbought.
Some AIQ users immediately enter the market when the US score moves to 85% or more on the buy side. They exit anytime the US score is 85% or more on the sell side. I don’t recommend this approach because the market can stay overbought or oversold for quite some time. Instead, it may be best to wait for a trend-following indicator such as the Directional Movement Index to confirm the new trend direction.
Rather than using the US score as a strict market timing model, use it as a simple tool to keep your emotions in check. It helps you avoid buying high or selling low. Here is the rule: Don’t turn bearish on the market and sell positions when the US score shows 85% or more buy signals. Similarly, never turn bullish or add positions when the US score shows 85% or more sell signals. This rule sounds simple but your emotions will tell you otherwise. When the US score has a high percentage of buy signals, the market has fallen and news reports are gloomy. That’s when your emotions tell you to bail. You may be selling right at a low, however. You either should have already sold or you should wait until the market rallies enough to where the US score is no longer giving a bullish reading.
When the market rallies it gets easier to buy. News reports are better and you think you may miss a big rally if you don’t immediately buy. Your emotions tell you to buy more but the US score can counteract your emotions. Don’t buy until the market pulls back enough to bring the US score out of bearish territory. Preferably, wait until the US score turns bullish Monitoring the US score on a daily basis gives you a good indication of the market’s health. It helps to control your emotions because it turns more bullish as the market falls and it turns more bearish as the market rises.
.