One of my favorite chart tools is Fibonacci Retracements. I find it really useful on retracements both from a high and from a low point.
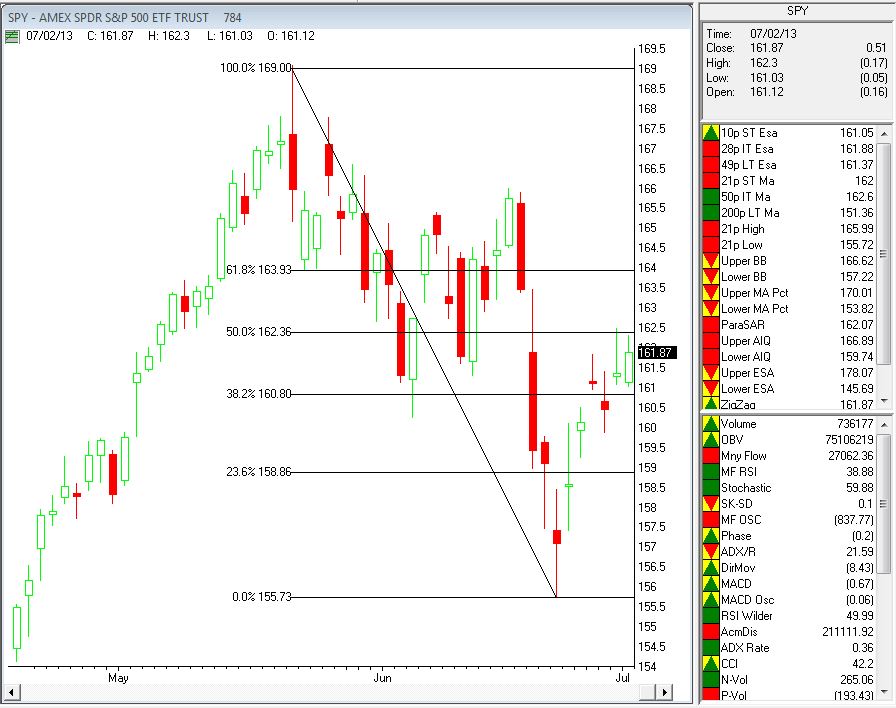
Here’s what I mean on the SPY July 2, 2013 chart below.
I’ve run the retracement from the high of May 20, 2013 to the recent low on June 24, 2013. The levels generated provide possible resistance levels to the rally from the low. I find the 50% and 61.8% levels most useful. In this example the market is struggling to break through the 50% retracement of this down move at around $162.5. If it does break out, the next level of resistance is at 61.8% or when SPY is around $164. if the rally fails at the 50% retracement then I consider the retracement pattern completed.
Incidentally, I drew this retracement 2 days after the low on June 24, 2013.