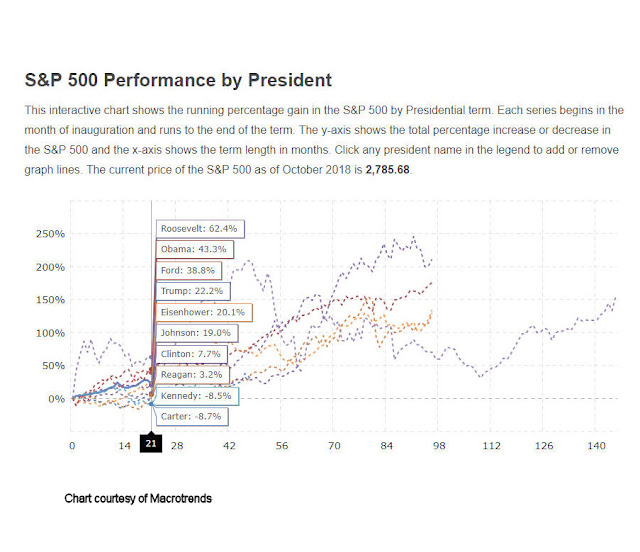
I often wondered just how much influence a President has on the stock market and found this interesting chart from Macrotrends.
In the first 21 months from their inauguration you can see the top 10 performing Presidents. Who would have thought Gerald Ford would be so far up the list. Of course geopolitical events and prior President and Congress actions also take time to percolate into the market.
Obama came into office soon after the 2008 financial crisis unemployment near 9% in 2009 and Ford after the oil crisis and Nixon. There are of course many other influencing factors, but a good rule of thumb In economic terms, the first year or so of any administration is just a carryover from the previous administration.
Probably the most significant contributor for the last decade has been the Federal Reserve chairs who have kept short-term rates low, while driving longer-term rates down by buying up $4.5 trillion of US government bonds and mortgage-backed securities. Lower returns has driven many investors into riskier assets like Stocks and this has helped fuel the stock market run that began in March 2009 and continues today.
Economics aside, the current correction, and yes we are still in corrective territory can be seen in this SPX monthly chart. The Fibonacci retracement drawn from the low of the February 2018 correction to the recent high shows we’re at or past the 38.2% level. The next significant level is at 50% level of around 2729.

