As I write the stock market is headed higher. As a trend-follower by nature (sorry it’s just my nature) I try to avoid sitting around and stewing in “The End is Near” type of thinking. For the record there is a lesson in that. Stop for a moment and think about all of the predictions of “the top” you have heard or read in roughly the last 17 months or so as the market has moved relentlessly higher (Thank you Fed – for now).
Those predictions all fall into one of three categories – Wrong, wrong or wrong.
Still, the phrase that “all good things got to come to an end” remains essentially a universal truth. My hope is that the major averages (and the majority of stocks) will break through to the upside and take out their recent highs and continue to power higher. But if this rally fails…………it might make sense to be prepared. Please note that I am not intending to imply that if the market fails to make new highs that Armageddon will ensue. But the market does appear to be losing some momentum (more on this topic in a moment). And once the “worm turns”, well, corrections tend to happen pretty quickly and at times pretty ferociously.
So my best advice at the moment is “enjoy the ride, but please take a moment to locate the nearest exit.”
Is The Market Losing Momentum?
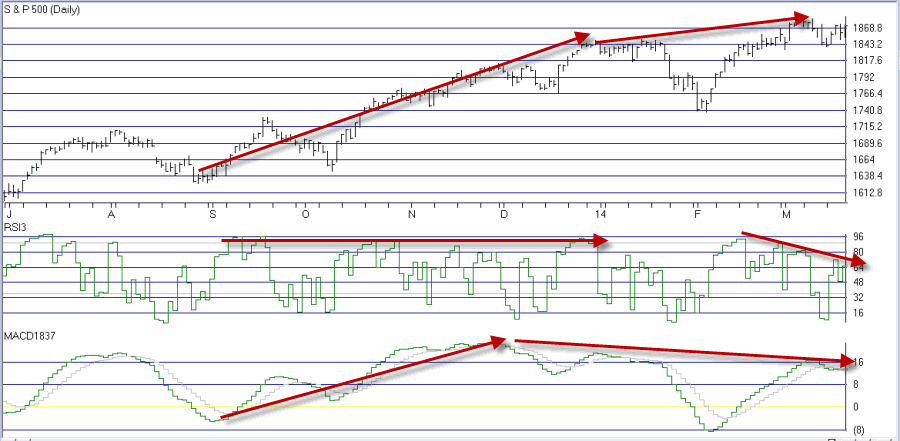
Figure 1 displays the S&P 500 daily bar chart at the top with the 3-day RSI and the MACD (18/37/9) indicator at the bottom.
Note that during the second half of 2013 as the S&P 500 moved higher both of the indicators confirmed the move. Since the first of this year both indicators have been forming a bearish divergence – i.e., price moves to a new high while the indicators do not. Now once again it should be noted that simple divergences happen from time to time and do not imply the end of the world as we know it. But they do flash a warning sign that alert traders should pay attention.
So there are two scenarios to watch for:
1) The S&P 500 index and other major average move to new highs and the indicators “stop diverging” and once again “start confirming” (This is “Good”).
2) The S&P 500 and other major average fail to make a new high or briefly reach new high ground and then reverse, while the indicators continue to signal weakness (This is “Bad”).
My advice is to pay close attention in the days and week ahead.
One Way to Play
This idea is merely “food for thought” and a little too soon to act upon in my opinion (i.e., the time to consider acting is if and when the market fails to follow through to a new high and the indicators remain weak). But if you want to consider a “cheap hedge” here is an example that uses the “Garbage Trade” I’ve written about (that I learned from Gustavo Guzman) of late.
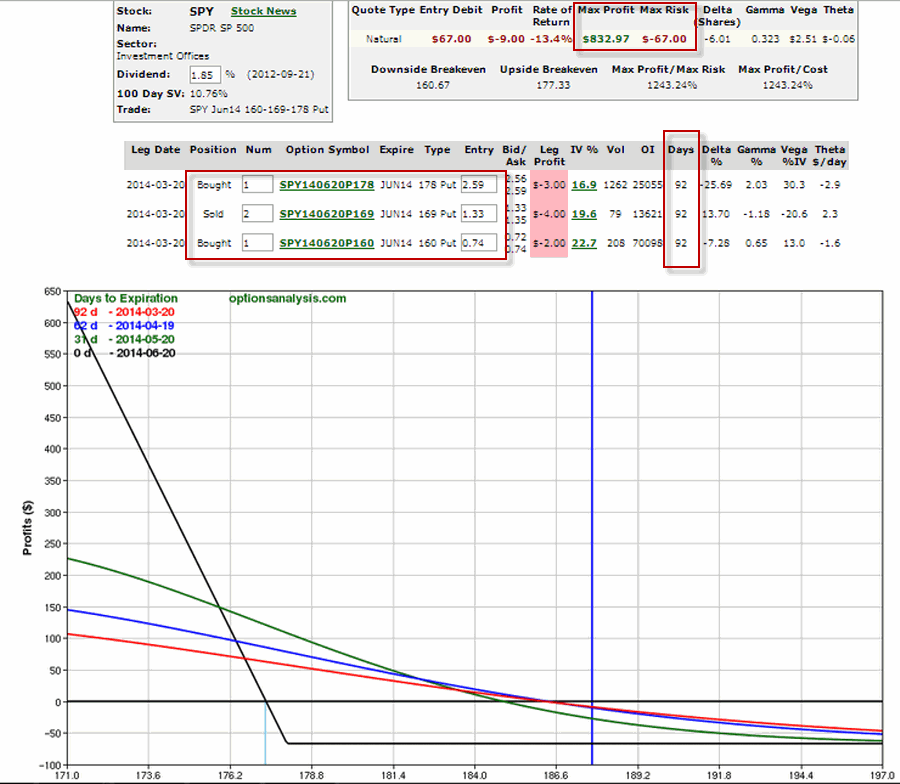
The example trade displayed in Figure 2 involves:
Buying 1 June SPY 178 put option
Selling 2 June SPY 169 put options
Buying 1 June SPY 160 put options
At present prices this trade costs $67 to enter. If SPY got back down to about 181 this trade would generate an open profit in the range of 100%. If things actually did “fall apart” (again, not “predicting” just “preparing”) this trade would generate a profit of several hundred percent.
Again, not really a trade to make right now, but rather an idea to keep in the back of your mind, you know, just in case…..
Jay Kaeppel Chief Market Analyst at JayOnTheMarkets.com and AIQ TradingExpert Pro (http://www.aiq.com) client


