The importable AIQ EDS file based on Markos Katsanos’ article in the April issue of Stocks & Commodities, “Detecting High-Volume Breakouts,” can be obtained on request via email to info@TradersEdgeSystems.com.
Excerpt “Is there anything more satisfying for a trader than capturing a huge breakout? The usual practice for breakout entries is to simply buy new highs. This method, when used in isolation, will often result in false breakouts. It is, therefore, better to wait for volume confirmation before entering the trade, as high-volume breakouts usually last much longer. In this article, I will show you how to detect breakouts using only volume, sometimes even before price breaks out, by introducing a new volume breakout indicator. “
The code is also available here:
!Detecting High-Volume Breakouts !Author: Markos Katsanos, TASC April 2021 !Coded by: Richard Denning, 02/18/2021
!INPUTS:
period is 30.
smoLen is 3.
vpnCrit is 10.
maLen is 30.
V is [volume].

!FORMULAS:
MAVol is simpleavg(V,period).
MAV is iff(MAVol>0,MAVol,1).
Avg is ([High]+[Low]+[Close])/3.
MF is Avg - valresult(Avg,1).
ATR is simpleavg(max( [high]-[low],max(val([close],1)-[low],[high]-val([close],1))),period).
MC is 0.1*ATR.
VMP is iff(MF > MC, V, 0).
VP is sum(VMP,period).
VMN is iff(MF < -MC, V, 0).
VN is sum(VMN,period).
VPN is (expavg(((VP - VN) / MAV / period),smoLen))*100.
MAVPN is simpleavg(VPN,maLen).
Code for the VPN indicator is set up in the AIQ code file. Figure 9 shows the indicator on a chart of Tesla Motors Inc (TSLA).
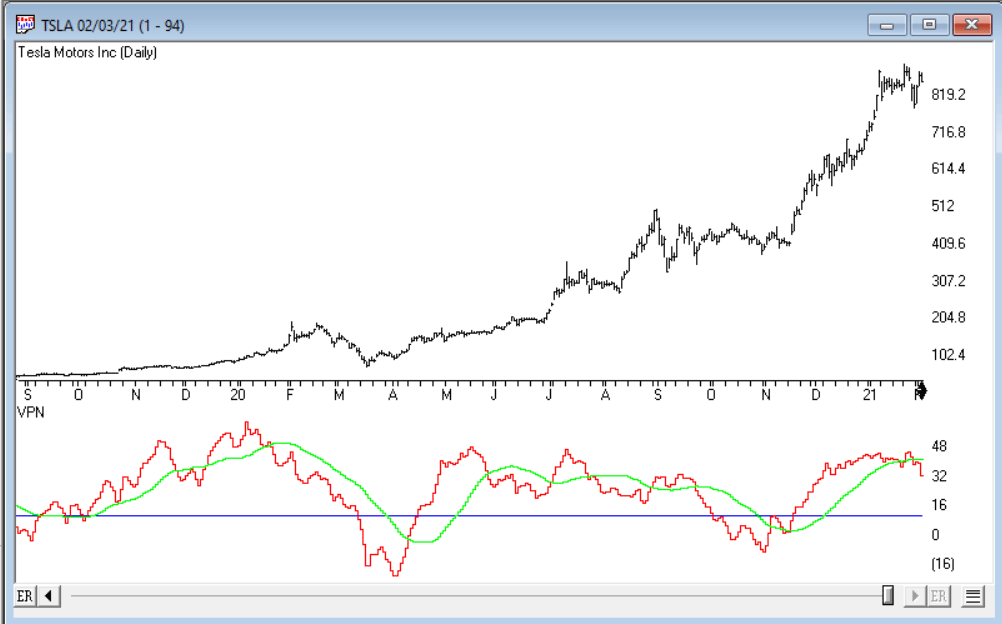
FIGURE 9: AIQ. The VPN indicator is shown on a chart of Tesla Motors Inc. (TSLA).
—Richard Denning
info@TradersEdgeSystems.com
for AIQ Systems