The AIQ code based on Giorgos Siligardos’ article in this issue, “Applying The Sector Rotation Model,” in July 2012 Stocks & Commodities is provided at the following website: www.TradersEdgeSystems.com/traderstips.htm.
Siligardos’ approach relies on sector ETFs. Since sector ETFs have limited price history, I searched for similar sector representations that would have more history. I found that there are S&P 500 sector indexes that start on 9/11/1989 and thus have almost 23 years of history.
In the table in Figure 6, I show the symbols for the sector representations for the three data services DialData from Track Data, Yahoo! from yahoo.com, and PremiumData from Norgate. The first column of the table shows the ETF symbol. The second column shows the AIQALL (a group/sector list structure) sector symbols. You could code the sector rotation indicator using the program-computed sectors as shown, but the results will vary from user to user because the sector values depend on the stocks that are in the user’s database.
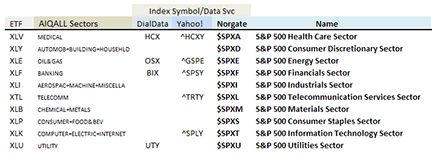
Since I couldn’t find symbols for some of the sectors at DialData and Yahoo, I decided to use the sector indexes from Norgate (shown in bold in Figure 6). AIQ can use data from any source by using the data transfer utility to import the data from ASCII text files. In the code file I provide, there is an input that allows you to switch between the ETF data symbols and the indexes (useIDX=0 for ETFs and useIDX=1 for indexes).
Please note that I changed the Norgate symbols upon import to remove the “$” as I wasn’t sure this symbol would be allowed as a ticker symbol. So the symbol “$SPXA” from Norgate is changed to “SPXA,” and so on. I have also provided extra code for the other sectors that are not used by the author in case you want to try using different sector combinations in the bull-bear indicator.
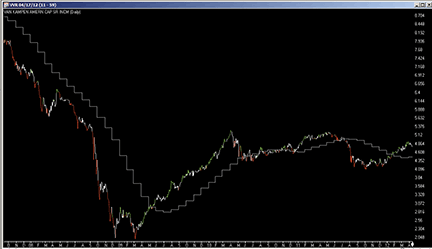
Since Siligardos does not provide a mechanical trading system that uses the indicator, I devised one that uses two moving averages of the bull-bear indicator: one set at 50 bars and the other set at 200 bars. Entries to go long occur when the fast average crosses over the slower average. I exit on cross downs or whenever the SPX 50-bar average is lower than it was 10 bars ago.
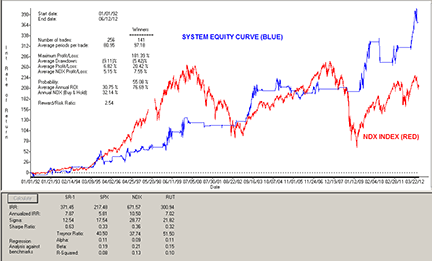
Since this is mainly a market timing device, I then tried trading the NASDAQ 100 list of stocks using the Portfolio Manager for the period 1/1/1992 to 6/12/2012. The following capitalization settings were used:
- Maximum of 10 open positions
- Size each position at 10% of mark-to-market total capital
- Take no more than 10 new positions per day
- Compute the mark-to-market capital each day
- Choose signals based on a relative strength indicator for ranking in descending order for longs (long-only system)
The resulting equity curve is shown in Figure 7, which is compared to the NASDAQ 100 index (NDX). With these settings, the internal rate of return averaged 7.9% with a maximum drawdown of 22.4% on 11/20/1995.
!APPLYING THE SECTOR ROTATION MODEL
!Author: Giorgos E. Siligardos, TASC August 2012
!Coded by: Richard Denning 6/6/2012
!www.TradersEdgeSystems.com

!For the US market, the S&P 500 sector exchange traded funds
!(ETFs) or SP500 indexes [IDX] used by author:
 !financial   (XLF) or [SPXF] or [BIX]
 !consumer discretionary (XLY) or [SPXD] or
 !energy   (XLE) or [SPXE] or [OSX]
 !consumer staples  (XLP) or [SPXS] or
 !utilities  (XLU) or [SPXU] or [UTY]
!Other S&P 500 sectors:
 !health care  (XLV) or [SPXA] or [HCX]
 !materials  (XLB) or [SPXM]
 !industrials  (XLI) or [SPXI]
 !telcom   (XLT) or [SPXT]
 !technology  (XLK) or [SPXT]

!INPUTS:
RC_LEN is 95. !LENGTH FOR RATE OF CHANGE
useIDX is 1. !SWITCHES BETWEEN ETF=0 AND IDX=1

!ABBREVIATIONS:
C is [close].

!CUSTOM FORMULAS:
FIN is iff(useIDX=1,TickerUDF("SPXF",C),TickerUDF("XLF",C)).
CDS is iff(useIDX=1,TickerUDF("SPXD",C),TickerUDF("XLY",C)).
ENE is iff(useIDX=1,TickerUDF("SPXE",C),TickerUDF("XLE",C)).
CSP is iff(useIDX=1,TickerUDF("SPXS",C),TickerUDF("XLP",C)).
UTL is iff(useIDX=1,TickerUDF("SPXU",C),TickerUDF("XLU",C)).
HLT is iff(useIDX=1,TickerUDF("SPXA",C),TickerUDF("XLV",C)).
MAT is iff(useIDX=1,TickerUDF("SPXM",C),TickerUDF("XLB",C)).
IND is iff(useIDX=1,TickerUDF("SPXI",C),TickerUDF("XLI",C)).
TEL is iff(useIDX=1,TickerUDF("SPXL",C),TickerUDF("XLI",C)).
TEK is iff(useIDX=1,TickerUDF("SPXT",C),TickerUDF("XLK",C)).
SPX is TickerUDF("SPX",C).

FINrc is (FIN/valresult(FIN,RC_LEN)-1)*100.
CDSrc is (CDS/valresult(CDS,RC_LEN)-1)*100.
ENErc is (ENE/valresult(ENE,RC_LEN)-1)*100.
CSPrc is (CSP/valresult(CSP,RC_LEN)-1)*100.
UTLrc is (UTL/valresult(UTL,RC_LEN)-1)*100.
HLTrc is (HLT/valresult(HLT,RC_LEN)-1)*100.
MATrc is (MAT/valresult(MAT,RC_LEN)-1)*100.
INDrc is (IND/valresult(IND,RC_LEN)-1)*100.
TELrc is (TEL/valresult(TEL,RC_LEN)-1)*100.
TEKrc is (TEK/valresult(TEK,RC_LEN)-1)*100.

BullSR is (FINrc + CDSrc) / 2.
BearSR is (ENErc + CSPrc + UTLrc) / 3.

!PLOT AS HISTORIGRAM:
BullBearOsc is BullSR - BearSR.

!PLOT AS TWO LINE INDICATOR WITH ZERO LINE SUPPORT:
BBavgF is simpleavg(BullBearOsc,50).
BBavgS is simpleavg(BullBearOsc,200).

!REPORTS & TRADING SYSTEM USING THE INDICTOR:
List if 1.
FirstDate is firstdatadate().

HD if hasdatafor(200+10) >= 200.
HDsec if TickerRule("XLF",HD) and TickerRule("XLY",HD)
 and TickerRule("XLE",HD) and TickerRule("XLP",HD)
 and TickerRule("XLU",HD) and TickerRule("SPX",HD).
HDidx if TickerRule("SPXF",HD) and TickerRule("SPXD",HD)
 and TickerRule("SPXE",HD) and TickerRule("SPXS",HD)
 and TickerRule("SPXU",HD) and TickerRule("SPX",HD).
SPXma is simpleavg(SPX,50).
Buy if BBavgF > BBavgS and valrule(BBavgF < BBavgS,1)
 and ((useIDX=1 and HDidx) or (useIDX<>1 and HDsec)).
xBuy if BBavgF < BBavgS and valrule(BBavgF> BBavgS,1)
 or SPXma < valresult(SPXma,10).

!FOR RANKING STOCKS TO TRADE:
StockRC is (C/valresult(TEK,RC_LEN)-1)*100.