The Dow was up modestly, the internals not so hot. We download the snapshot 30 minutes before the trading day closed 8-22-19. This video shows what we found, and how you can use this to get ahead of the rest of the market.
The fastest way to browse hundreds of charts end of day is back with a vengeance. AIQ TradingExpert Pro has always been known for its ability to browse hundreds of daily price charts at blizzard speeds (one of the many unique features in the platform).
The fastest way to browse hundreds of charts end of day is back with a vengeance. AIQ TradingExpert Pro has always been known for its ability to browse hundreds of daily price charts at blizzard speeds (one of the many unique features in the platform).
Also includes historical data on US and Canadian stocks updated every night and Mutual Fund NAVs updated each night.
How do traders use this powerful data?
For the Chart Pattern Recognition traders this is the Ferrari of analysis tools. It’s simple to scan hundreds of charts to see the patterns emerging the same day it’s happening.
For traders who look for groups or sectors on the move, our intraday snapshot updates AIQ’s powerful groups and sectors too, so you can get ahead of a move in the market segments before the rest of the crowd.
For traders who want to place trades in the last hour of the trading day, downloading a snapshot in the last hour of trading day has almost the entire days action for your stocks, you can do your end of day analyze and place tomorrows trades today.
PLUS all the powerful features of AIQ TradingExpert Pro end of day including
AI-based Signals Uncover Hidden Trades – Award winning AI-based expert system screens for trading candidates that may have been missed by other systems, giving you an edge.
Time Saving Analysis with Chart Barometer – Our Indicator Barometer gives you an instant evaluation of the status of all indicators for each chart. Saving you time and allowing an easy to read analysis of any ticker.
Every Chart your way with Custom Layouts – Whether you prefer price bar, candlestick, or point and figure charts, we’ve got them. Plus, TradingExpert Pro delivers all the trendline and drawing tools that you expect in a top end package, including Fibonacci Studies, Gann Fans, and Regression Lines.
Time Saving Power! 200 Screening Reports – TradingExpert Pro automatically performs millions of computations and delivers instant access to one and two-page reports highlighting trading candidates for stocks, indexes, mutual funds, groups and sectors and more. Want to find tickers in a trend? We got it. Relative strength? Upside and downside at your fingertips. Volume Spikes, Persistence of Money Flow, Price Gap, Point and Figure Breakouts and many many more……All generated each day automatically…
Building a Trading System just got a Whole lot Easier – TradingExpert Pro provides an amazing way to design, test, and automate virtually any trading idea. It’s called the Expert Design Studio and is considered by traders to be the best tool of its kind. That’s because it combines a point-and-click interactive trading library with state-of-the-art back testing and gives you the ability to produce custom screening reports. PLUS our Pre-built strategies have been fine-tuned by our analysts to produce outstanding results. They include Growth, Divergence, Short Selling, Day Trading, and Bottom Fishing models, to name just a few.
Complete Array of Analysis Tools – TradingExpert Pro’s Proven Market Timing “too good to ignore.” Introduced in 1986, AIQ’s market timing system called the Crash of ‘87 and has called all major market moves since. Its multi-indicator, rule-based approach for determining market direction is time proven.
AND TradingExpert Pro also includes:
Professional Level Portfolio Management
Matchmaking Correlation tools
Automate Your Winning Systems with Portfolio Simulation Tools
Also includes historical data on US and Canadian stocks updated every night and Mutual Fund NAVs updated each night.
Over the last month the S&P 500 has fallen 4.1%, and 2.2% from my VERY CAUTIOUS SIGNAL of the 2954 break. Even though the markets are down for the month, they are still up nicely for the year. Bonds have rallied as well as commodities such as gold and silver.
Last month I stated that there was a Bearish pattern emerging called a Rising Wedge and I talked about the negative break of the pattern and once it closed below that pattern I went negative. You can clearly see the pattern on the chart below. Now that it has broken to the downside what happens now?
We are not fortune tellers on what Trump will say or tweet, we don’t know what the Chinese will say or how they will react, but the technicals are not that bad and are starting to get a little more positive. My computer models are currently at a short term BUY signal, but things change daily like the tweets.
You have heard that because of the inverted yield curve, where typical money market is yielding 2% and the 10 year bond is yielding 1.6%. You can see that it is inverted. The 10 year bond should be yielding above the daily money market, not below it. Because of this and the inversion of most of the bonds, there might be a recession in about 1 to 1.5 years. I have been saying that over my last many Bartometers that I see a recession in about a year and a half, but not yet. What may be causing the inversion, may be foreign countries that have a negative yield actually buying our 2 to 30 year bonds and pushing the price up and the driving the yields down.
My fundamental economist Dr. Robert Genetski, from classicalPrinciples.com believes that while most observers believe that trade barriers are the main headwind facing stocks, like the Chinese tariffs, he is more concerned over a restrictive monetary policy. Signs of monetary restraint from interest rates and liquidity suggest that the odds of a recession have increased.
The S&P 500 is now 10% below his estimate of its value. As such, a positive announcement on trade or money can quickly send stocks soaring. For the moment the Fed will resist easing policy.
However, if stocks and interest rates continue to decline, constant pressure from the President to ease policy will lead to an abrupt, positive change. Such a change would quickly allow a resumption of the bull market in stocks.
On the Technical Side
My computer models went on a very short BUY signal last week, but there are three resistance and 2 support levels you may want to remember, 2944 is the first level where the S&P may stall and 2954.71 is the next major level that if broken and it I closes above that level many traders may come in and start buying possibly pushing the markets up and testing the old highs of 3025.
On the other hand, on the downside 2823 has buying support and 2799 is the 200 day moving average. That may hold too. It is now trading in a channel, 2944 on the top and 2823 on the bottom. A close of either one of those areas could mean the next major up or down trend direction.
Interest Outlook
I see the Federal Reserve reducing interest rates ¼% in December.
Index Averages
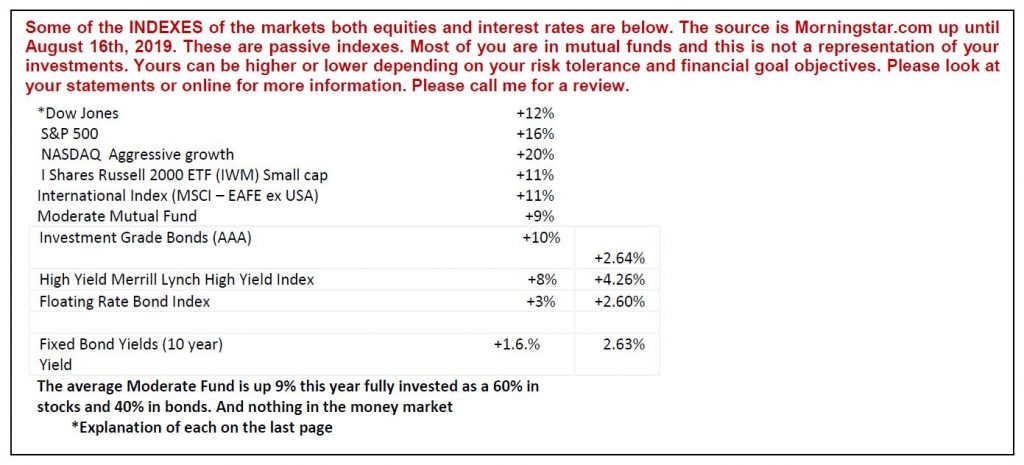
Some of the INDEXES of the markets both equities and interest rates are below. The source is Morningstar.com up until August 16th, 2019. These are passive indexes.
*Explanation of each on the last page
The S&P 500
Rising Wedge
Support
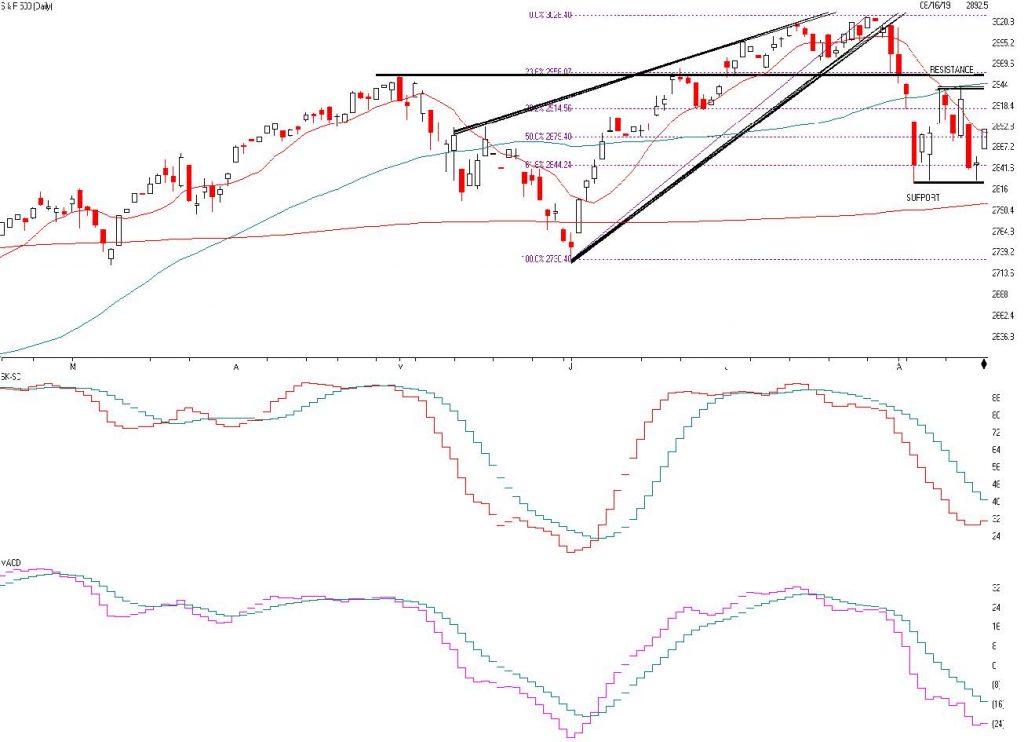
The S&P 500 is above. Last month I stated that there was a Rising Wedge Pattern that was technically bearish and that a break below the bottom of the pattern would make me Very Cautious. Now that it has broken below that pattern it is trading between 2823 and 2944. If the S&P closes above 2944 it could push it to 2954 where it could find heavier resistance. If it stays above 2954 for 2 to 3 days with heavy volume the market may have turned to a Bullish stance, but Volatility will remain. Even though we went to a SHORT TERM BUY signal, I am still a little Cautious.
The 2nd and third chart show the SK-SD Stochastics. At 32-40 where the arrow is pointing shows that the market is getting oversold and getting cheap and ready for a bounce. The third graph shows that the market momentum is still negative as the pink line is below the green line. A Short term Buy signal would be generated when the pink line crosses over the green line showing that momentum is again on the bullish side. As of right now the market technicals are getting better and a close above 2954.71 could change the trend to the positive side. Support levels on the S&P where there may be buying support is 2823, 2727 the 200 moving average, and 2730 the test and the low of the June low. I like the USA markets more than the International markets.
Source: AIQ Systems on graphs
The rising wedge pattern is characterized by a chart pattern which forms when the market makes higher highs and higher lows with a contracting range. When this pattern is found in an uptrend, it is considered a reversal pattern, as the contraction of the range indicates that the uptrend is losing strength. When this pattern is found in a downtrend, it is considered a bearish pattern, as the market range becomes narrower into the correction, indicating that the correction is losing strength, and that the resumption of the downtrend is in the making.
In a rising wedge, both boundary lines slant up from left to right. Although both lines point in the same direction, the lower line rises at a steeper angle than the upper one. Prices usually decline after breaking through the lower boundary line. As far as volumes are concerned, they keep on declining with each new price advance or wave up, indicating that the demand is weakening at the higher price level. A rising wedge is more reliable when found in a bearish market. In a bullish trend what seems to be a Rising Wedge may actually be a Flag or a Pennant (stepbrother of a wedge) requiring about 4 weeks to complete
Rising Wedges are not guaranteed so the 3019-3022 level and staying there for a couple of days could void this negative pattern. A break decisively on a close below 2979 could satisfy the Rising Wedge.
Source: Investopedia
*A Support or support level is the level at which buyers tend to purchase or into a stock or index. It refers to the stock share price that a company or index should hold and start to rise. When a price of the stock falls towards its support level, the support level holds and is confirmed, or the stock continues to decline, and the support level must change.
▪ Support levels on the S&P 500 area are 2844, 2803, and 2730. These might be BUY areas.
▪ Support levels on the NASDAQ are 7862, 7657, 7416, and 7291.
▪ On the Dow Jones support is at 25,376, 25,213, and 24,686. These may be safer areas to get into the equity markets on support levels slowly.
▪ RESISTANCE LEVEL ON THE S&P 500 IS 2944, 2954.71 and 302 . If there is a favorable tariff settlement, the market should rise short term.
THE BOTTOM LINE:
The S&P 500 is currently about 2.2% below my Very Cautious signal of 2954. The market should be volatile especially with seasonal patterns of August through the end of October being seasonally weak. With the inverted yield curve and hints of recession over the next 1.5 years investors should be somewhat cautious over the shorter term unless the S&P 500 closes above 2944 and more if it closes about 2954.71 and stays there for a couple of days with heavy volume. It looks like the market wants to goes up but with tweets coming out hourly, market timing will be more difficult. If things come in as Trump expects, watch for a solid rally possibly to the old highs. But there are headwinds currently short term.
Best to all of you,
Joe
Joe Bartosiewicz, CFP®
5 Colby Way
Avon, CT 06001
860-940-7020 or 860-404-0408
Investment Advisor Representative
SECURITIES AND ADVISORY SERVICES OFFERED THROUGH SAGE POINT FINANCIAL INC., MEMBER FINRA/SIPC, AND SEC-REGISTERED INVESTMENT ADVISOR. Charts provided by AIQ Systems:
Technical Analysis is based on a study of historical price movements and past trend patterns. There is no assurance that these market changes or trends can or will be duplicated shortly. It logically follows that historical precedent does not guarantee future results. Conclusions expressed in the Technical Analysis section are personal opinions: and may not be construed as recommendations to buy or sell anything.
Disclaimer: The views expressed are not necessarily the view of Sage Point Financial, Inc. and should not be interpreted directly or indirectly as an offer to buy or sell any securities mentioned herein. Securities and Advisory services offered through Sage Point Financial Inc., Member FINRA/SIPC, and SEC-registered investment advisor.
I apologize for getting my newsletter out a week later than usual, my family had a needed short vacation.
Now for the good news, last month I stated that I was bullish on the markets and said I thought the markets would break out of the old 2886 level on the S&P and go to the 2954 level and possibly go to new highs. See last month’s Bartometer. The good news is the S&P is now at new highs and up another 6% since last month. The not so good news is that the small to midcap stocks are NOT at a new high and this divergence is showing me that we have a select narrow rally. The Small Cap index is 10% below its old top hit on 09/28/21018.
The Midcap Index is down 4.7% from last September as well. What does this mean? It means that there is a divergence in the stock market, and most of the participation is in the very large stocks like Microsoft, Netflix, etc. Even though this divergence is happening, my computer models are still somewhat bullish. Is it changing? You’ll see the answer in the chart below
Source: CNBC.com
Interest Outlook
As the major indexes reached all new highs, the Fed Chairman confirmed that the Fed would accept the lead from financial markets and cut their target interest rate by ¼%. Even though the Fed may reduce interest rates, there are many problems with Powell’s statements. His comments do not bode well for future moves. Especially if the economy goes into a recession over the next year or more. At this time long term rates should continue to be stabilized.
CURRENT EVENTS INFLUENCING MARKET MOVEMENT:
The Chinese tariff situation has calmed down somewhat allowing the markets to continue to rise as earnings from U.S. companies continue to grow. Overall the economy is doing relatively well. With a potential slowing of earnings ahead, the stock markets are now somewhat overbought. If interest rates stay at this very low level, then the stock market is still a decent value, but if interest rates start to head higher, the stock market ascent will then be over for a while. Overall, things look okay.
Index Averages
Some of the INDEXES of the markets both equities and interest rates are below. The source is Morningstar.com up until July 12, 2019. These are passive indexes.
*Dow Jones +18% S&P 500 +21% NASDAQ Aggressive growth +25% I Shares Russell 2000 ETF (IWM) Small cap +17% International Index (MSCI – EAFE ex USA) +11% Moderate Mutual Fund +11% Investment Grade Bonds (AAA) + 7% +2.64% High Yield Merrill Lynch High Yield Index +9% +4.26% Floating Rate Bond Index +5% +2.60% Fixed Bond Yields (10 year) +2.% Yield 2.63% The average Moderate Fund is up 11.6% this year fully invested as a 60% in stocks and 40% in bonds. And nothing in the money market *Explanation of each on the last page The S&P 500 Source: AIQ Systems on graphs
The S&P 500 has broken out to a new high last month on the Bartometer I was Bullish and stated that my computer models went to a Buy signal on June 4th at 2800 on the S&P 500. Now it is 3014. My computer models are still on the BUY-HOLD but the market is now getting very OVERBOUGHT and if I were in the market now I would start to take some money off the table and rebalance if you are in retirement.
The S&P 500 could go to 3130 to 3180 this year, but that would be a stretch and I don’t think the market has that much growth now for the rest of the year. Maybe 3-7% if that.
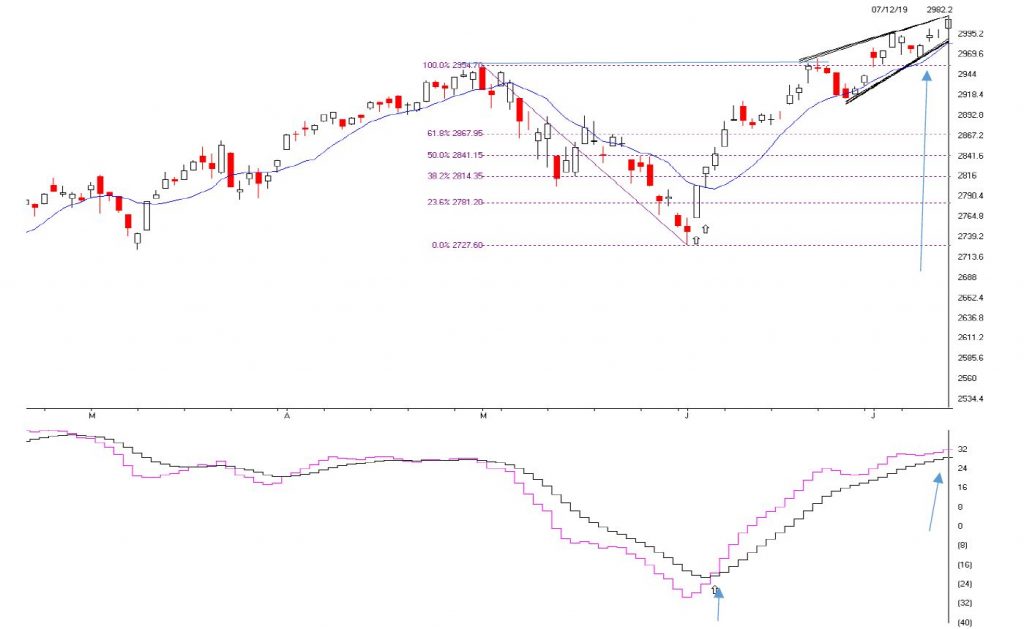
Notice the two trend-lines above at the top right of the top chart. There are two rising trend-lines, the blue arrow is pointing to it. This is call a RISING WEDGE. A Rising Wedge is a NEGATIVE pattern IF the trend-line is broken on the down side. This is a pattern that can be VOIDED if the S&P 500 closes above 3019 -3022 for 2-3 days with heavy volume. On the other hand, it the S&P 500 breaks below 2979, I will be getting Cautious. If it closes below 2979 then 2954 better hold or I will be getting VERY CAUTIOUS. But remember if the market closes above 3019-3022 for 2 to 3 days with good volume then the pattern is voided.
This market is extended, so even though I am relatively still positive, I’ll let the market tell me what to do. So if the S&P Closes below 2979 I am getting Cautious, and a close below 2954 decisively, then I am getting Very Cautious. That means a trimming of your assets, or a partial sell and to transfer to more of a conservative account. Right now I am still BULLISH.
The second chart below is the MACD, a cross down could correspond with the breaking of 2954 DECISIVELY on a close. Notice in June it crossed above, see blue arrow, this was a great place to BUY. Now that it is much higher and with the extension of the market I gave you the information as to where the market could reverse and what to look for.
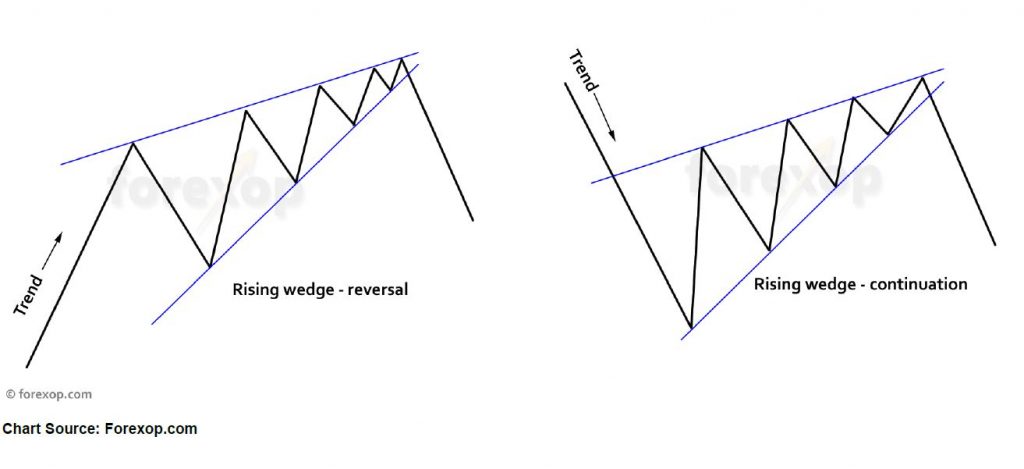
Chart Source: Forexop.com
The rising wedge pattern is characterized by a chart pattern which forms when the market makes higher highs and higher lows with a contracting range. When this pattern is found in an uptrend, it is considered a reversal pattern, as the contraction of the range indicates that the uptrend is losing strength.
When this pattern is found in a downtrend, it is considered a bearish pattern, as the market range becomes narrower into the correction, indicating that the correction is losing strength and that the resumption of the downtrend is in the making.
In a rising wedge, both boundary lines slant up from left to right. Although both lines point in the same direction, the lower line rises at a steeper angle than the upper one. Prices usually decline after breaking through the lower boundary line.
As far as volumes are concerned, they keep on declining with each new price advance or wave up, indicating that the demand is weakening at the higher price level. A rising wedge is more reliable when found in a bearish market. In a bullish trend what seems to be a Rising Wedge may be a Flag or a Pennant (stepbrother of a wedge) requiring about four weeks to complete.
Rising Wedges are not guaranteed, so the 3019-3022 level and staying there for a couple of days could void this negative pattern. A break decisively on a close below 2979 could satisfy the Rising Wedge.
Source: Wikipedia
*A Support or support level is the level at which buyers tend to purchase or into a stock or index. It refers to the stock share price that a company or index should hold and start to rise. When a price of the stock falls towards its support level, the support level holds and is confirmed, or the stock continues to decline, and the support level must change.
Support levels on the S&P 500 area are 2986, 2954, 2910, and 2780 areas. These might be BUY areas.
Support levels on the NASDAQ are 8175, 7884, 7771, and 7657.
On the Dow Jones support is at 26918, 26708, 25,538 and 26318.
These may be safer areas to get into the equity markets on support levels slowly. RESISTANCE LEVEL ON THE S&P 500 IS 3019 but rising as market goes up. If there is a favorable tariff settlement, the market should rise short term.
Source: Investopedia
THE BOTTOM LINE:
The S&P 500 has reached a new high, and as long as 2954 does not break down decisively with a lot a volume I am still relatively positive. We are positively OVERBOUGHT here short, so THIS IS NOT A TIME TO BUY a lot of Indexes here in my opinion I am still relatively Bullish.
The S&P needs to close above 3019-3022 and stay there two days to form another base from which to rise more, but if the S&P breaks below 2979, and daily this trend-line is rising, I will be getting Cautious, and a convincing close below 2954 will get me Very Cautious.
Best to all of you, Joe Joe Bartosiewicz, CFP® Investment Advisor Representative
860-940-7020 or 860-404-0408
SECURITIES AND ADVISORY SERVICES OFFERED THROUGH SAGE POINT FINANCIAL INC., MEMBER FINRA/SIPC, AND SEC-REGISTERED INVESTMENT ADVISOR.
Charts provided by AIQ Systems:
Technical Analysis is based on a study of historical price movements and past trend patterns. There is no assurance that these market changes or trends can or will be duplicated shortly. It logically follows that historical precedent does not guarantee future results. Conclusions expressed in the Technical Analysis section are personal opinions: and may not be construed as recommendations to buy or sell anything.
Disclaimer: The views expressed are not necessarily the view of Sage Point Financial, Inc. and should not be interpreted directly or indirectly as an offer to buy or sell any securities mentioned herein. Securities and Advisory services offered through Sage Point Financial Inc., Member FINRA/SIPC, an SEC-registered investment advisor.
Past performance cannot guarantee future results. Investing involves risk, including the potential loss of principal. No investment strategy can guarantee a profit or protect against loss in periods of declining values. Please note that individual situations can vary. Therefore, the information presented in this letter should only be relied upon when coordinated with individual professional advice. *There is no guarantee that a diversified portfolio will outperform a non-diversified portfolio in any given market environment. No investment strategy, such as asset allocation, can guarantee a profit or protect against loss in periods of declining values.
It is our goal to help investors by identifying changing market conditions. However, investors should be aware that no investment advisor can accurately predict all of the changes that may occur in the market.
The price of commodities is subject to substantial price fluctuations of short periods and may be affected by unpredictable international monetary and political policies. The market for commodities is widely unregulated, and concentrated investing may lead to Sector investing may involve a greater degree of risk than investments with broader diversification.
Indexes cannot be invested indirectly, are unmanaged, and do not incur management fees, costs, and expenses.
Dow Jones Industrial Average: A weighted price average of 30 significant stocks traded on the New York Stock Exchange and the NASDAQ.
S&P 500: The S&P 500 is an unmanaged indexed comprised of 500 widely held securities considered to be representative of the stock market in general.
NASDAQ: the NASDAQ Composite Index is an unmanaged, market-weighted index of all over the counter common stocks traded on the National Association of Securities Dealers Automated Quotation System
(IWM) I Shares Russell 2000 ETF: Which tracks the Russell 2000 index: which measures the performance of the small capitalization sector of the U.S. equity market.
A Moderate Mutual Fund risk mutual has approximately 50-70% of its portfolio in different equities, from growth, income stocks, international and emerging markets stocks to 30-50% of its portfolio indifferent categories of bonds and cash. It seeks capital appreciation with a low to moderate level of current income.
The Merrill Lynch High Yield Master Index: A broad-based measure of the performance of non-investment grade US Bonds
MSCI EAFE: the MSCI EAFE Index (Morgan Stanley Capital International Europe, Australia, and Far East Index) is a widely recognized benchmark of non-US markets. It is an unmanaged index composed of a sample of companies’ representative of the market structure of 20 European and Pacific Basin countries and includes reinvestment of all dividends.
Investment grade bond index: The S&P 500 Investment-grade corporate bond index, a sub-index of the S&P 500 Bond Index, seeks to measure the performance of the US corporate debt issued by constituents in the S&P 500 with an investment grade rating. The S&P 500 Bond index is designed to be a corporate-bond counterpart to the S&P 500, which is widely regarded as the best single gauge of large cap US equities.
Floating Rate Bond Index is a rule-based, market-value weighted index engineered to measure the performance and characteristics of floating rate coupon U.S. Treasuries which have a maturity greater than 12 months.
Joe Bartosiewicz, CFP®
5 Colby Way
Avon, CT 06001
860-940-7020 or 860-404-0408
AIQ explore list is a powerful and very fast method to view many charts quickly. In this video Steve explores daily and weekly charts simultaneously looking for MACD divergences and double top and bottoms.
Stephen Hill is President of AIQ Systems. For the past 15 years he has been involved in all aspects of AIQ Systems, from support and sales to programming and education. Steve is a frequent speaker at events in the U.S. and Europe, talking on subjects as diverse as Portfolio Simulation Techniques, Advanced Chart Pattern Analysis and Trading System Design.
Chart pattern analysis, often thought of as part science part art is a key element in many traders decision process. Common patterns like double tops and bottoms are somewhat self-fulfilling, given that most of us can see these patterns occurring. Measures of what consititues a double top or bottom in good analytical terms we’ll save for another article. In this this article we are focussing on two of my favorite chart patterns; Flags and Pennants
Flags and Pennants are Consolidation or Continuation Patterns
These patterns break out in the direction of the previous trend, confirming the existing trend, suggesting that investors are considering whether the market is overbought or oversold but ultimately deciding to confirm the existing trend. Flags and pennants are of two types, bullish or bearish
Flags and pennants are generally considered continuation patterns as they breakout in the prevailing trend direction. They represent a brief pause especially after a steep run up in an active ticker. They are a fairly common and useful for short term trading.
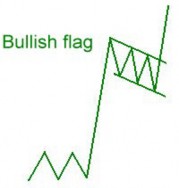
Bullish Flags – formation
Lower tops and lower bottoms bounded by two parallel trendlines with pattern slanting against the prevailing trend are considered bull flags (figure 1).
Figure 1. Bullish flag pattern
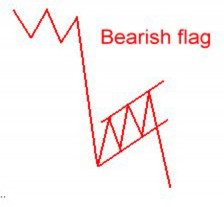
Bearish Flags – formation
Higher tops and higher bottoms bounded by two parallel trendlines with pattern slanting against the prevailing trend are considered bear flags. (figure 2).
Figure 2. Bearish flag pattern
Elements of bullish flags
A rapid and steep price rise of around 20% from bottom of the pole to top.
Decreasing volume during the formation of the flag.
Breakout occurs to the upside with resumption of increase volume levels
Flags length excluding the pole classic should be around 10 days, can be less but not more than 20 days.
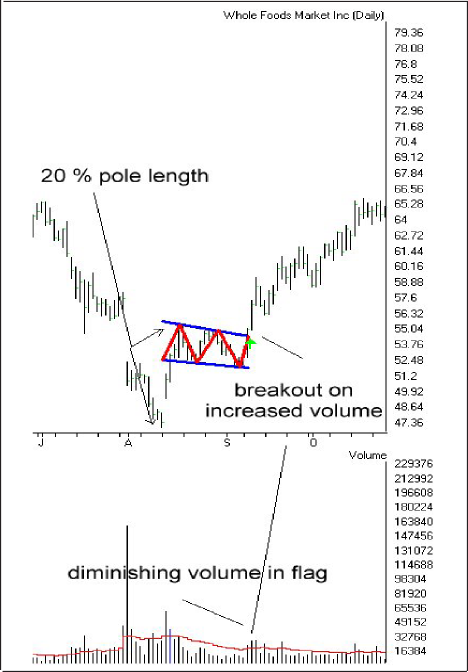
Figure 3. Whole Foods Market, Inc (WFMI) bullish flag
Bulkowski noted that the high and tight flag performed best. (source Encyclodpedia of Chart Patterns by Thomas Bulkowski). 2Some 25% of the patterns are horizontal notes Markos Katsanos. (source Measuring Flags & Pennants: Technical Analysis of Stocks and Commodities vol 23 no 4)bullish flag breakout on increased volume note the pole length is 20% + of the price action and the diminishing volume on the flag.
Elements of bearish flags
A rapid and steep price decline of around 20% from top of the pole to bottom.
Decreasing volume during the formation of the flag.
Breakout occurs to the downside with resumption of increase volume levels.
Flag length excluding the pole should be around 10 days, can be less but not more than 20 days.
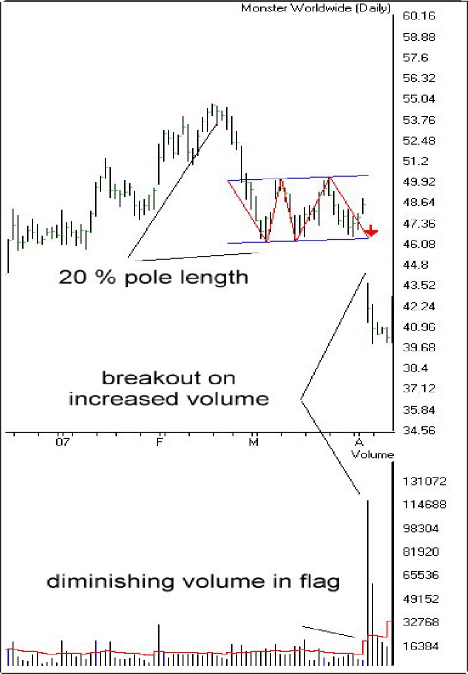
Figure 4 shows MNST classic bearish flag breakout on increased volume note the pole length is 20% + of the price action and the diminishing volume on the flag.
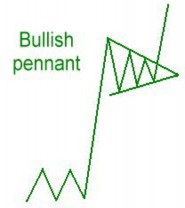
Bullish Pennants – formation
Pennants look very much like symmetrical triangles, on the end of a pole, typically they are smaller in size and duration (figure 5).
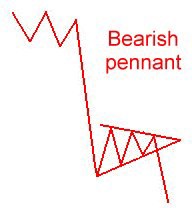
Bearish Pennants – formation
An upside down bullish pennant, the triangle is at the bottom of the pole. (figure 6).
Elements of bullish pennants
A rapid and steep price rise of around 20% from bottom of the pole to top.
Decreasing volume during the formation of the pennant.
Pennants look like symmetrical triangles on a pole, price action is converging.
Diminishing volume as pennant forms.
Breakout to the upside with re- sumption of volume levels.
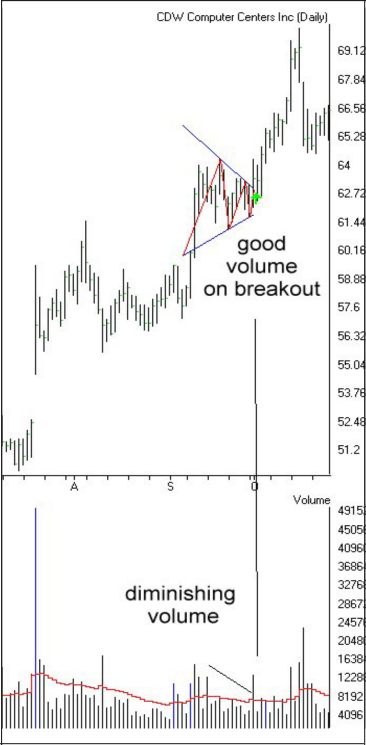
Pennant length excluding the pole should be around 10 days, can be less but not more than 20 days.Figure 7 shows CDW classic bullish pennant breakout on increased volume
A rapid and steep price drop of around 20% from top of the pole to bottom.
Decreasing volume during the formation of the pennant.
Pennants look like symmetrical triangles on a pole, price action is converging.
Diminishing volume as pennant forms.
Breakout to the downside with resumption of volume levels.
Pennant length excluding the pole should be around 10 days, can be less but not more than 20 days.
How do you trade flags and pennants?
Katsanos study of Flags and pennants revealed that the average breakout was 45% over an average period of 11 days. Bulkowski noted a 63% average gain. to trade these breakouts, set tight stops at low of day before breakout and use trailing stops once breakout occurs.
Target prices are more difficult to predict as these are continuation patterns, but after 11 days you are beyond the average move in days.
AIQ tip
Once a breakout occurs, use AIQ space on right of the chart (rtalerts only) and advance 11 days into the future. Draw a trendline parallel to the pole trend from the breakout point.