Hello Everyone,
Market Recap:
Over the last month, the market has gone down about 4%, then rebounded nearly 3% to a slight decline of 1% over the previous month. The continual news of the Impeachment, slower orders on manufacturing, and the Chinese tariff discussions have made the market more volatile. October is usually a bottoming month, and November and December are traditionally higher. Last year, this did not happen. The market bottomed on December 26, 2018, and surged from that date to July with a return of 21% from January to July 2019.
An excerpt from Fundamental Economist Dr. Robert Genetski: from Classical Principles.com:
“This week’s main positive event was Fed Chairman Powell’s indication that the Fed would resume purchasing securities. Assuming the Fed follows through, this represents a game-changer in terms of next year’s economy and conditions of the nearterm outlook for stocks. Another potential positive development is Trump’s view that talks regarding a trade agreement are going well. I continue to expect a limited deal as a first step in improving trade with China. The rise in stock futures last Friday indicates that investors expect an agreement”.
Adding to Bob’s his Comment:
With or without a trade agreement, the outlook for stocks has improved with Powell’s comments. Purchases of securities improve the odds the economy will do very well next year. If it does, there’s a better chance of avoiding a destructive move toward socialist policies. Stocks are still subject to a decline if there is a failure to reach a trade agreement. However, monetary policy is more important. Without sufficient money, the economy would decline even with a trade agreement. While the Fed’s purchases of securities won’t impact the economy until the spring, they should impact both stocks and interest rates almost immediately. The Fed’s decision to purchase securities provides a reason to move to a fully invested position in equity portfolios.
On the Technical Side:
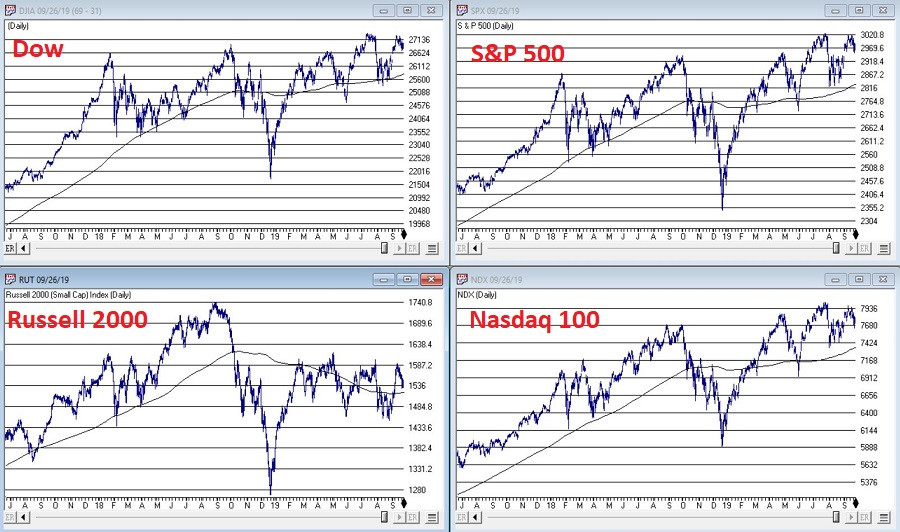
Over the last almost two years, the markets haven’t done much at all. (See the Monthly Chart below). The markets have been volatile after the prior seven-year run. Earnings have been soft, but the markets seem to want to go higher. The stock market NEEDs to BREAKOUT of the old highs of the Dow Jones at 27400, S&P 500 at 3029, and the NASDAQ 8340. The markets are only about 1 to 2% from a Major Breakout. But it needs the volume and conviction of more certainty in the Chinese trade agreement and the economy that has been showing some signs of a slowing. Earnings have been slowing so we are at a critical point in the markets again. October can be a volatile month, so it is vital that if the markets don’t breakout soon it will cause sellers and traders to start the selling again. If the Dow closes below 25740, I will be getting Cautious, and 25335. I will be Getting Very Cautious.
Some of the INDEXES of the markets both equities and interest rates are below. The source is Morningstar.com up until October 11th, 2019.
Dow Jones +17%
S&P 500 +20%
NASDAQ Aggressive growth +24%
I Shares Russell 2000 ETF (IWM) Small cap +13%
International Index (MSCI – EAFE ex USA) +13%
Moderate Mutual Fund +10%
Investment Grade Bonds (AAA) +11%
High Yield Merrill Lynch High Yield Index +9%
Floating Rate Bond Index +3-5%
Short Term Bond +3%
Fixed Bond Yields (10 year) +1.72.% Yield
The average Moderate Fund is up 10% this year fully invested as a 60% in stocks and 40% in bonds and nothing in the money market.
Interest Outlook
I see the Federal Reserve reducing interest rates ¼% in December.

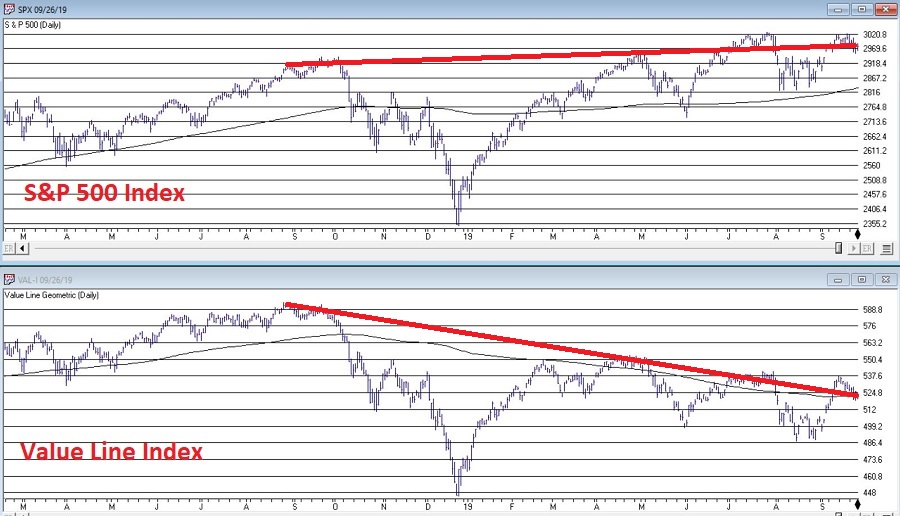
The Dow Jones Index is above. As it contains 30 of the largest industrial and American stocks. I wanted to show you the 10 year performance and the LONG TERM of the Dow Jones. Notice that the Dow has done very well from 2010 until 1/31/2018. Since then the Dow Jones has gone up and down and is up about 1% in about 2 years. It is right near its old high of the last 1.9 years. There are three indicators above that are important. The first one is the MACD and or Momentum index. As you can see from the index is that it has lost momentum. See the index drifting lower. This shows that the market have lost the upside breakout push. It needs the volume push upward and it needs volume and good news from the government to push it higher and break out to push it above the 27400.
There are two indicators that look GOOD The Money Flow Indicator is at a new high as well as the On Balance Volume Indicator. These indicators are important to determine where the overall market is headed. When both of them are at new highs but the market is not at a new high it shows that there is DEMAND for stocks. It’s not guaranteed that the market will breakout but is a pretty good indicator that it will. With all of the Tweeting and volatility in the market this is not a greatest of indicators but it is more accurate without all of the volatile news. There is a somewhat of a Bullish patter above called an Ascending Triangle. It shows a rise of the trend line and that is bullish. See the vertical blue arrow pointing upward. This will many time breakout to the UPSIDE. But if the Dow Jones closes below 25740 I will be getting Cautious and if it breaks below 25335 on a close I will be getting Very Cautious.
Support levels on the S&P 500 area are 2916, 2823, 2746, and 2921. These might be BUY areas.
Support levels on the NASDAQ are 7967, 7782, 7644, and 7407.
On the Dow Jones support is at 26,285, 25,763, and 25,458
These may be safer areas to get into the equity markets on support levels slowly.
RESISTANCE LEVEL ON THE S&P 500 IS 30280 Dow Jones breakout is 27,400. If there is a favorable tariff settlement, the market should rise short term.
THE BOTTOM LINE:
The Dow, the S&P 500 and the NASDAQ are all near new highs after rallying over the last two weeks. Since then, the markets have rallied near their old highs. There are technical patterns that show the markets could breakout to new highs, but IF THE MARKETS DON’T BREAKOUT OUT SOON, THE MARKETS COULD TOP OUT. I WILL CONTINUE TO ANALYZE THE TECHNICALs OF THE MARKET.
There are seasonal patterns that are usually weak. October is NOT SEASONALLY strong. It’s often a bottoming month. It looks like the market wants to go up, but with tweets coming out hourly, market timing will be more difficult. If things come in as Trump expects, watch for a substantial rally possibly to the old highs. But there are headwinds currently short term.
Best to all of you,
Joe Bartosiewicz, CFP®
Investment Advisor Representative
Contact information:
5 Colby Way
Avon, CT 06001
860-940-7020 or 860-404-0408
SECURITIES AND ADVISORY SERVICES OFFERED THROUGH SAGE POINT FINANCIAL INC., MEMBER FINRA/SIPC, AND SEC-REGISTERED INVESTMENT ADVISOR.
Charts provided by AIQ Systems:
Technical Analysis is based on a study of historical price movements and past trend patterns. There is no assurance that these market changes or trends can or will be duplicated shortly. It logically follows that historical precedent does not guarantee future results. Conclusions expressed in the Technical Analysis section are personal opinions: and may not be construed as recommendations to buy or sell anything.
Disclaimer: The views expressed are not necessarily the view of Sage Point Financial, Inc. and should not be interpreted directly or indirectly as an offer to buy or sell any securities mentioned herein. Securities and Advisory services offered through Sage Point Financial Inc., Member FINRA/SIPC, an SEC-registered investment advisor. Past performance cannot guarantee future results. Investing involves risk, including the potential loss of principal. No investment strategy can guarantee a profit or protect against loss in periods of declining values. Please note that individual situations can vary. Therefore, the information presented in this letter should only be relied upon when coordinated