Well that got ugly quick. For the record, if you have been in the markets for any length of time you have seen this kind of action plenty of times. An index, or stock, or commodity or whatever, trends and trends and trend steadily and relentlessly higher over a period of time. And just when it seems like its going to last forever – BAM. It gives back all or much of its recent rally gains very quickly. Welcome to the exciting world of investing.
I make no claims of “calling the top” – because I never have actually (correctly) called one and I don’t expect that I ever will. But having written Part I and Part IIof articles titled “Please Take a Moment to Locate the Nearest Exit” in the last week, I was probably one of the least surprised people at what transpired in the stock market in the last few sessions.
Of course the question on everyone’s lips – as always in this type of panic or near panic situation – is, “where to from here?” And folks if I knew the answer, I swear I would tell you. But like everyone else, I can only assess the situation, formulate a plan of action – or inaction, as the case may be – and act accordingly. But some random thoughts:
*Long periods of relative calm followed by extreme drops are more often than not followed by periods of volatility. So, look for a sharp rebound for at least a few days followed by another downdraft and so on and so forth, until either:
a) The market bottoms out and resumes an uptrend
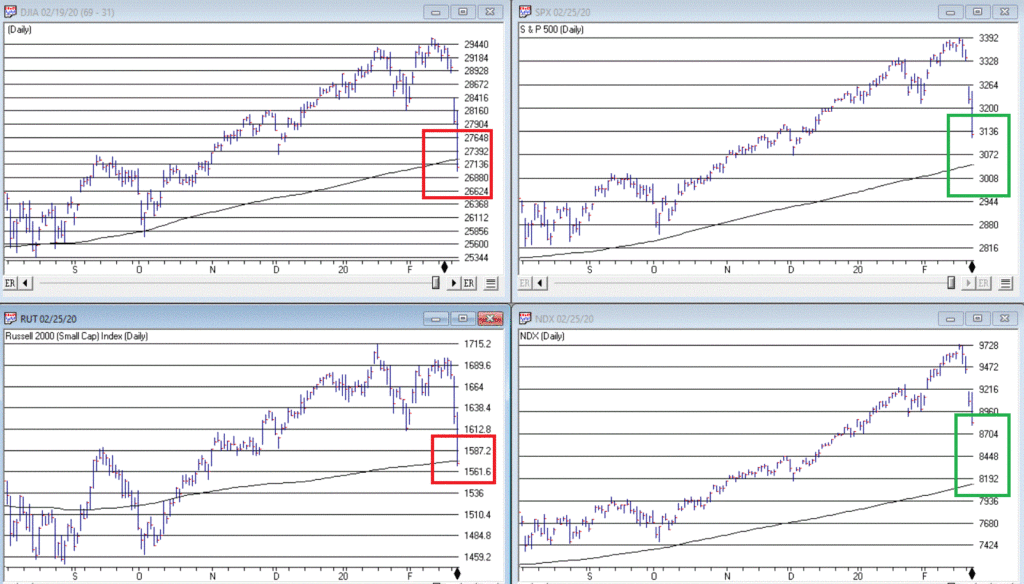
b) The major indexes (think Dow, S&P 500, Nasdaq 100, Russell 2000) drop below their 200-day moving averages. As of the close on 2/25 both the Dow and the Russell 2000 were below their 200-day moving average. That would set up another a) or b) scenario.
If the major indexes break below their long-term moving averages it will either:
a) End up being a whipsaw – i.e., the market reverses quickly to the upside
b) Or will be a sign of more serious trouble
The main point is that you should be paying close attention in the days and weeks ahead to the indexes in Figure 1.
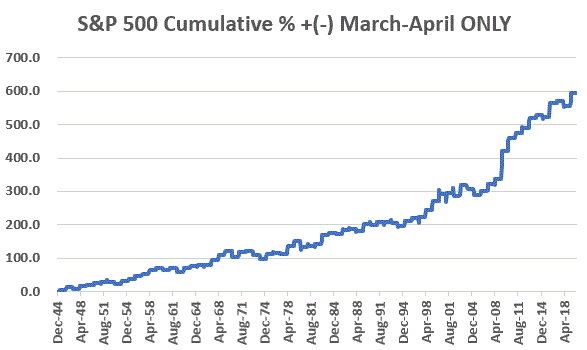
One reason for potential optimism is that the two-month period of March and April has historically been one of the more favorable two-month periods on an annual basis. Figure 2 displays the cumulative price gain achieved by the S&P 500 Index ONLY during March and April every year since 1945. The long-term trend is unmistakable, but year-to-year results can of course, vary greatly.
Figure 2 – S&P 500 cumulative price gain March-April ONLY (1945-2019)
For the record:
S&P 500 March-April
Result
Number of times UP
55 (73%)
Number of times DOWN
20 (27%)
Average UP%
+5.0%
Average DOWN%
(-3.4%)
Figure 3 – Facts and Figures
Will March and April bail us out? Here’s hoping.
As an aside, this strategy is having a great week so far.
Jay Kaeppel
Disclaimer: The information, opinions and ideas expressed herein are for informational and educational purposes only and are based on research conducted and presented solely by the author. The information presented does not represent the views of the author only and does not constitute a complete description of any investment service. In addition, nothing presented herein should be construed as investment advice, as an advertisement or offering of investment advisory services, or as an offer to sell or a solicitation to buy any security. The data presented herein were obtained from various third-party sources. While the data is believed to be reliable, no representation is made as to, and no responsibility, warranty or liability is accepted for the accuracy or completeness of such information. International investments are subject to additional risks such as currency fluctuations, political instability and the potential for illiquid markets. Past performance is no guarantee of future results. There is risk of loss in all trading. Back tested performance does not represent actual performance and should not be interpreted as an indication of such performance. Also, back tested performance results have certain inherent limitations and differs from actual performance because it is achieved with the benefit of hindsight.
It seems like a broken record, but the markets continue their upward trek. As the economy continues to be healthy, and the employment numbers continue to stupefy pundits, the markets continue to show optimism by pushing stocks higher. We had a slight 3-4% decline in the markets like I thought and then a resumption of its upward trend. At this point, the markets are now fundamentally overvalued by about 6-8% depending on the metrics used in determining overvaluation.
Warren Buffet said on CNBC a few months ago that “if interest rates stay where they are at 1.58% on the ten-year government bond, the stock market is reasonably priced. If interest rates rise to 2.5% that no one sees now, then the markets are 10-15% overvalued. At these prices, the markets are slightly overvalued.” CNBC also said that in 2000 the markets were 80-90% overvalued and in 2007, the markets were 30-35% overvalued. Again, the stock market is about 6-8% overvalued.
Market Perspective:
Could the market go up more? Yes, but if the Coronavirus scares the populous from traveling and going out, then the economic growth can surely suffer for some time. The stock market could easily have a 10% correction if the Coronavirus inhibits spending and keeps people in their homes. The best sector would be technology or things that are delivered to your home like online purchasing companies. I am CAUTIOUS on this market, as I can see optimism with no regard to the Coronavirus.
Sector Performance:
One of the best sectors again in the stock market is the Large Cap Technology growth stocks, like Apple, Microsoft, Tesla, Amazon and more. Because of the massive size of these companies now, i.e., Apple and Microsoft each being $1.5 trillion, any increase in their prices has a significant influence on the markets. The NASDAQ went up 38% last year and why it’s up 10% this year. It was due in large part due to the large growth sector with stocks like Apple Computer going up 88% and Microsoft up 56% over the last year. These extremely large tech companies are pushing up the market. Most stocks are not doing that well this year. It’s large tech stocks for the most part pushing this market higher.
This year the market is doing the same thing with Apple 11%, Microsoft +18%%, Alphabet +14%, and Amazon +16% and more. When stocks are so large and they go up a significant amount they can skew the market averages, making people think the markets are doing better than they are on average, when in fact, the small and midcap stock indexes are up only 1-2%%. In conclusion, either the small and midcap stocks have to catch up or the large growth and technology stocks have to fade.
Proceed with Caution:
Going up without a correction is not a good thing for the markets especially when people are now throwing money at the market. It’s called FOMO, or the Fear of Missing Out. This sort of panic to throw money at the index funds shows me that psychologically people think the markets will continue to rise steeply. It’s called a MELTUP. That’s a concern to me somewhat. The rise might continue and I am still relatively bullish as I think the S&P could hit 3450 to 3500 later in the year.
At this point, if you are in or nearing retirement and have more than 65% of your money in equities, you may want to scale back your equity exposure to below that amount. Remember the old saying, “you don’t make it until you take it.” Also, markets go down a lot quicker than they go up.
Expert Opinion:
An excerpt from Fundamental Economist Dr. Robert Genetski: from Classical Principles.com:
“A sharp jump in reported infections in China was due to an improved technique for diagnosing the disease, not a new explosive outbreak. There was no similar spike in cases outside of China. Japan has the second most cases outside of China at 255. 218 of Japan’s cases are on a quarantined cruise ship. The large number on the ship shows how infectious the virus can be. The good news is that there has been no upward trend in the number of infections outside of China. They continue to average close to 15 a day.”
Stock Market Outlook
Stocks racked up another strong week with gains ranging from 1⁄4% on the Dow to 1 1⁄2% for the NASDAQ and Nasdaq 100. Increases brought the S&P500 to 7 1⁄2% above my estimate of its fundamental value. Although stocks are slightly overvalued, strong growth in the economy and earnings can send them higher. Investors should remain cautiously bullish. Maintain a high level of exposure to stocks in equity portfolios despite the likelihood of some correction.
Interest Rates
Interest rates remained relatively stable this past week. While further upward pressure can be expected when the economy accelerates, the Fed’s efforts to keep interest rates low will continue to hold them close to current levels.
With central banks around the world, creating liquidity, any correction in the bull market should be limited. Stay bullish on stocks.
Monetary Policy
The Fed continues to purchase securities, and banks continue to adjust their excess reserves to accommodate the demand for loans and investments. Monetary policy is sufficient to allow for an expansion in business activity this spring.
Some of the INDEXES of the markets both equities and interest rates are below. The source is Morningstar.com up until January 10th, 2020. These are passive indexes.
Dow Jones +3.36% S&P 500 +4.89%
NASDAQ Aggressive growth +10.3% I Shares Russell 2000 ETF (IWM) Small cap +1.35% Midcap stock funds +1.81% International Stock Markets -0.3 of 1.0% Moderate Mutual Fund +2.2% Investment Grade Bonds (AAA) Long duration +2.2% High Yield Merrill Lynch High Yield Index +.95% Short Term Bond +.69% Fixed Bond Yields (10 year) +1.6% Yield
The average Moderate Fund is up +2.2% this year fully invested as a 65% in stocks and 35% in bonds and nothing in the money market.
Interest rates look stable going forward over the next 6 months
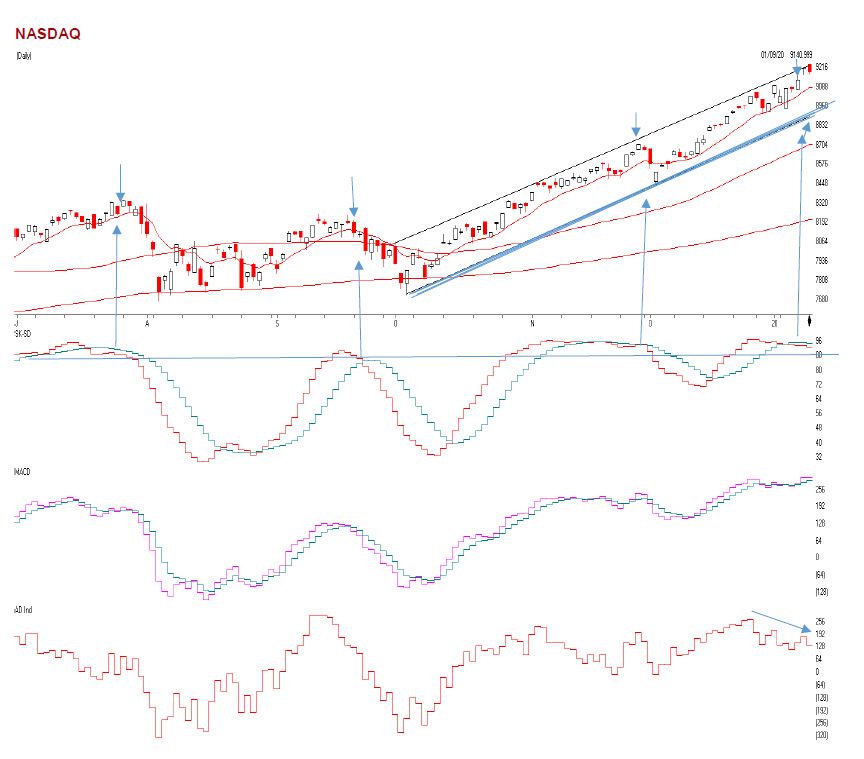
The first chart is the NASDAQ. Its largest companies are Apple, Microsoft, Google, Amazon and more. These stocks continue to get the bulk of the money. Because they are all over $1 Trillion, any increase to them skews the market averages on an equal weighted position. In other words, these 4 stocks are worth more than 15% of the market.
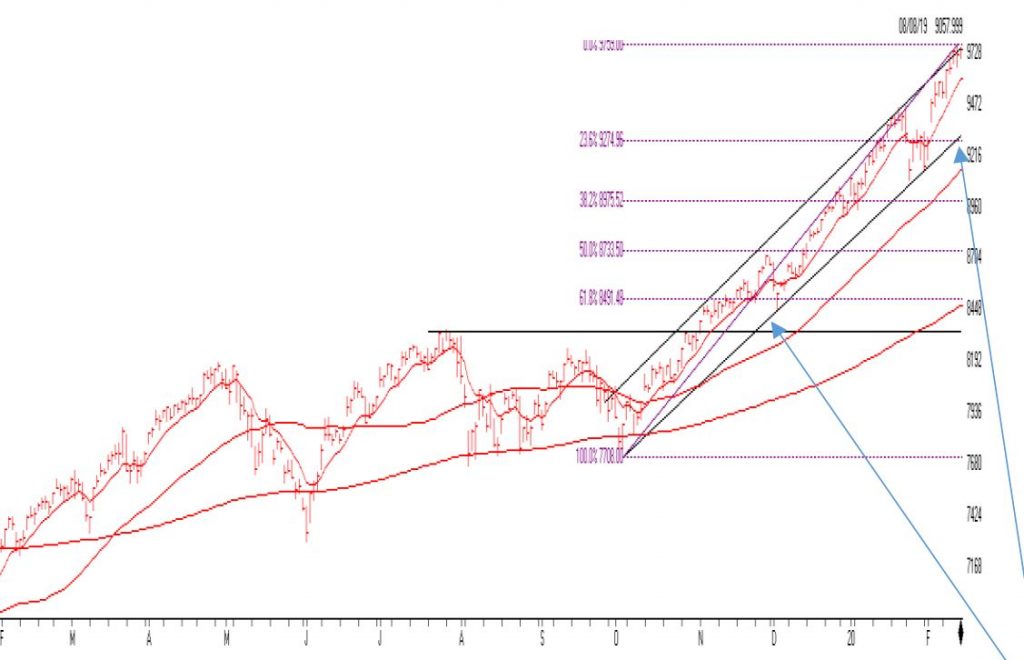
This is why, the markets are going straight up. Any increase in these stocks puts a large percentage increase in the average, basically it is because they are so large, and the Nasdaq and the S&P are market weighted indexes. Notice the channel. There are 3 touches of the channel. This means that if those trend lines in Black are broken, it could mean the end of this rise. So CURRENTLY, a break and close below 9274 in the Nasdaq could mean the beginning of a correction. That is a 4% drop in movement before I would get concerned.
NASDAQ Channel Charts provided by AIQ Systems:
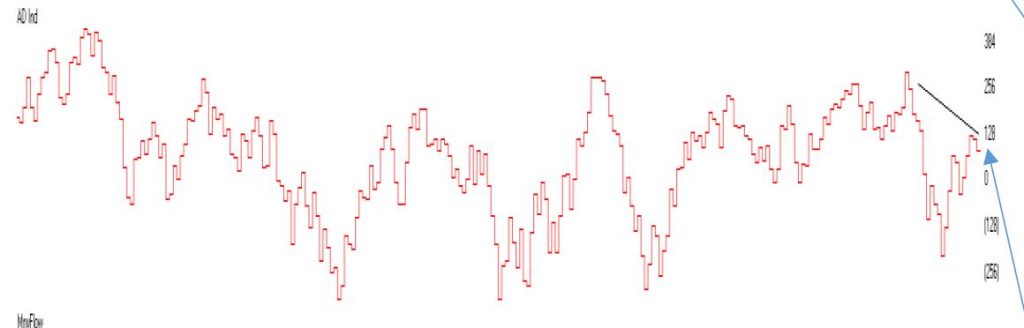
The next chart of the NASDAQ Advance Decline Line. Notice as the Nasdaq is reaching new highs, it is doing it on fewer and fewer stocks. It means the rally is narrow. Not a great sign. It’s a watching point.
NASDAQ Advance/Decline Line Charts provided by AIQ Systems:
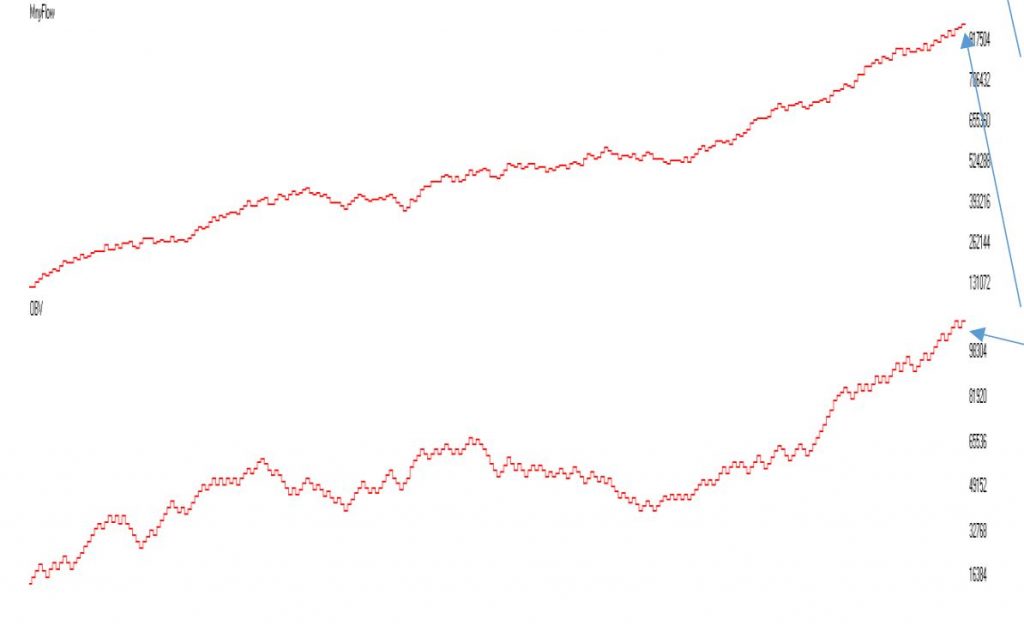
The next two charts are Money Flow and On Balance Volume. Both look good and confirming the upside.
The biggest concern is that although my computer models are at a BUY-HOLD. The Nasdaq is at the upper band top and it’s a narrow rally.
NASDAQ Moneyflow and On Balance Volume Charts provided by AIQ Systems:
A Support or support level is the level at which buyers tend to purchase or into a stock or index. It refers to the stock share price that a company or index should hold and start to rise. When the price of the stock falls towards its support level, the support level holds and is confirmed, or the stock continues to decline, and the support level must change.
– Support levels on the S&P 500 area are 3340, 3263 area, 3210, and 3186. These might be BUY areas. – Support levels on the NASDAQ are 9588, 9299, 9160, and 8975. – On the Dow Jones support is at 28,692, 27783 area, and 27385 Breakout and 200 days moving average. – These may be safer areas to get into the equity markets on support levels slowly. – RESISTANCE LEVEL ON THE S&P 500 3450.
THE BOTTOM LINE:
The market is somewhat overbought and about 6-8% overvalued at this time. There are now some cracks in the dam showing as explained above, but my computer systems are still at a Buy-Hold for the market direction. The markets are rallying on large-cap growth and technology stocks and watching the other smaller to midcap companies up only slightly with international stocks declining. Either we start to see the small and midcap stocks begin to rally or the market could begin to fall. The S&P could hit 3450 later in the year. Earnings could potentially grow 5 to 7% or more this year and that is why there is the possibility that the S&P 500 could reach 3450+ in 2020, a much smaller rise in the stock market than in 2019 but hopefully, a decent return, with obvious no guarantees expressed or implied. The Corona Virus COULD put a scare in the market that could put the travel industry and restaurant industry and more on hold, dropping earnings. The Federal Reserve could be more accommodative if this happens.
Best to all of you, Joe Bartosiewicz, CFP® Investment Advisor Representative 5 Colby Way Avon, CT 06001 860-940-7020 or 860-404-0408
SECURITIES AND ADVISORY SERVICES OFFERED THROUGH SAGE POINT FINANCIAL INC., MEMBER FINRA/SIPC, AND SEC-REGISTERED INVESTMENT ADVISOR.
Technical Analysis is based on a study of historical price movements and past trend patterns. There is no assurance that these market changes or trends can or will be duplicated shortly. It logically follows that historical precedent does not guarantee future results. Conclusions expressed in the Technical Analysis section are personal opinions: and may not be construed as recommendations to buy or sell anything.
Disclaimer: The views expressed are not necessarily the view of Sage Point Financial, Inc. and should not be interpreted directly or indirectly as an offer to buy or sell any securities mentioned herein. Securities and Advisory services offered through Sage Point Financial Inc., Member FINRA/SIPC, an SEC-registered investment advisor.
Past performance cannot guarantee future results. Investing involves risk, including the potential loss of principal. No investment strategy can guarantee a profit or protect against loss in periods of declining values. Please note that individual situations can vary. Therefore, the information presented in this letter should only be relied upon when coordinated with individual professional advice. *There is no guarantee that a diversified portfolio will outperform a non-diversified portfolio in any given market environment. No investment strategy, such as asset allocation, can guarantee a profit or protect against loss in periods of declining values.
It is our goal to help investors by identifying changing market conditions. However, investors should be aware that no investment advisor can accurately predict all of the changes that may occur in the market.
The price of commodities is subject to substantial price fluctuations of short periods and may be affected by unpredictable international monetary and political policies. The market for commodities is widely unregulated, and concentrated investing may lead to Sector investing may involve a greater degree of risk than investments with broader diversification.
Indexes cannot be invested indirectly, are unmanaged, and do not incur management fees, costs, and expenses. Dow Jones Industrial Average: A weighted price average of 30 significant stocks traded on the New York Stock Exchange and the NASDAQ. S&P 500: The S&P 500 is an unmanaged indexed comprised of 500 widely held securities considered to be representative of the stock market in general.
NASDAQ: the NASDAQ Composite Index is an unmanaged, market-weighted index of all over the counter common stocks traded on the National Association of Securities Dealers Automated Quotation System (IWM) I Shares Russell 2000 ETF: Which tracks the Russell 2000 index: which measures the performance of the small capitalization sector of the U.S. equity market.
A Moderate Mutual Fund risk mutual has approximately 50-70% of its portfolio in different equities, from growth, income stocks, international and emerging markets stocks to 30-50% of its portfolio in different categories of bonds and cash. It seeks capital appreciation with a low to moderate level of current income.
The Merrill Lynch High Yield Master Index: A broad-based measure of the performance of non-investment grade US Bonds MSCI EAFE: the MSCI EAFE Index (Morgan Stanley Capital International Europe, Australia, and Far East Index) is a widely recognized benchmark of non-US markets. It is an unmanaged index composed of a sample of companies’ representative of the market structure of 20 European and Pacific Basin countries and includes reinvestment of all dividends.
Investment grade bond index: The S&P 500 Investment-grade corporate bond index, a sub-index of the S&P 500 Bond Index, seeks to measure the performance of the US corporate debt issued by constituents in the S&P 500 with an investment-grade rating. The S&P 500 Bond index is designed to be a corporate-bond counterpart to the S&P 500, which is widely regarded as the best single gauge of large-cap US equities.
Floating Rate Bond Index is a rule-based, market-value weighted index engineered to measure the performance and characteristics of floating-rate coupon U.S. Treasuries, which have a maturity greater than 12 months.
Money Flow; The Money Flow Index (MFI) is a momentum indicator that measures the flow of money into and out of a security over a specified period. It is related to the Relative Strength Index (RSI) but incorporates volume, whereas the RSI only considers
SK-SD StochasticsWhen oversold stochastic moves up through its MA; a buy signal is produced. Furthermore, Lane recommends that the stochastic line be smoothed twice with three-period simple moving averages: SK is the three-period simple moving average of K, and SD is the three-period simple moving average of SK.
Rising Wedge; A rising wedge is a technical indicator, suggesting a reversal pattern frequently seen in bear markets. This pattern shows up in charts when the price moves upward with pivot highs and lows converging toward a single point known as the apex.
Microsoft is a global technology leader, constantly driving innovation and transforming the digital landscape. With cutting-edge mobile applications and cloud solutions, the company enables users to work, learn, and enjoy entertainment wherever they are.
Innovative Solutions for Business and Personal Use
Products such as Office 365 and the Azure platform have revolutionized the way both businesses and individuals operate. Microsoft’s mobile solutions provide seamless access to essential tools, ensuring productivity and connectivity on the go.
Security and Reliability
Security remains a top priority for Microsoft. Regular updates and advanced protection technologies guarantee that users’ data stays secure, whether they’re managing business tasks or accessing personal information.
Discover More
Committed to making technology accessible for everyone, Microsoft continues to innovate and grow. To explore the latest developments and learn more about their diverse range of products, visit the official website at Microsoft.
Last year was an excellent year for the markets in general, with the markets appreciating 19-38%, depending on the indexes. One of the best sectors was the large growth sector with stocks like Apple Computer going up 88% and Microsoft up 56% over the last year. That is why the NASDAQ went up 38% This year; the market is doing the same thing with Apple +5%, Microsoft +3%, Alphabet +6%, Facebook +6%, and Amazon +3%.
When stocks are so large, and they go up a significant amount, they skew the market averages and make people think the markets are doing very well when in fact, the small and midcap stock indexes are down .5% -1.6%.
The participation of this current rally is VERY NARROW, meaning just a small number of large stocks are pushing this market higher and when the markets are climbing on only a few stocks then either the small and midcap stocks have to catch up or the large growth and technology stocks have to fade.
On my December Bartometer, I thought the market would rally towards the rest of the year and I thought the FIRST level of resistance would be 3280 on the S&P 500. Friday, the S&P 500 hit 3281 intraday high and closed at 3265. Even though I am still Bullish longer term, I think the markets require some healthy pullback… Going up without a correction is not suitable for the markets especially when people are now throwing money at the market. It’s called FOMO, or the Fear of Missing Out. This sort of panic to throw money at the index funds shows me that psychologically people think the markets will continue to rise. That scares me a little.
The rise might continue and I am still relatively bullish as I think the S&P could hit 3400 later in the year, but I am worried that one of the only sectors that are moving is the large-cap technology sector. At this point, if you are in or nearing retirement and have more than 65% of your money in equities, you may want to scale back your equity exposure to below that amount. Remember the old saying; you don’t make it until you take it.
An excerpt from Fundamental Economist Dr. Robert Genetski: from Classical Principles.com:
Another week of good news and another week of record-high prices for the major stock indexes. Technology remains the most robust sector with both the Nasdaq and Nasdaq 100 gaining more than a percent. The S&P500 and Dow were up ½%. Small caps continue to languish.
Trump’s strategy in dealing with Iran increases the odds of his reelection. Iran looks even less competent for failing to protect Soleimani, having more than 50 people trampled to death at his funeral, and then possibly shooting down their civilian airplane.
With central banks around the world, creating liquidity, any correction in the bull market should be limited. Stay bullish on stocks.
Some of the INDEXES of the markets both equities and interest rates are below.
The source is Morningstar.com up until January 10th, 2020.
Dow Jones +1.1% S&P 500 +1.2% NASDAQ Aggressive growth +2.7% I Shares Russell 2000 ETF (IWM) Small cap – .47 of 1% Midcap stock funds -.48 of 1% International Index (MSCI – EAFE ex USA 1.0% Moderate Mutual Fund Investment Grade Bonds (AAA) Long duration +.56 of 1% High Yield Merrill Lynch High Yield Index +.46 of 1% Short Term Bond +.22 of 1% Fixed Bond Yields (10 year) +1.8.% Yield The average Moderate Fund is up .62 of 1% this year fully invested as a 65% in stocks and 35% in bonds and nothing in the money market.
Interest rates look stable going forward over the next 6 months
The Dow Jones Average is above. This index for the 5 largest stocks are Boeing, Apple, United healthcare, Goldman Sachs and Home Depot. They are the mix of American industry, but only contain 30 stocks. Even though the Dow is rising,
Look to the 3 graphs below the chart. You will see the horizontal blue line. When that is over 88 as it is, it shows that the market is OVERBOUGHT. Then when the green line falls below the green line you see the market selling off. It is there again, so be careful. The second graph shows Money flow/ Volume Accumulation. When this goes negative like it is below zero or the horizontal line, it shows that there is some distribution or selling pressure.
The last graph shows the Advance decline line. This is the number of stocks going up compared to the number of stocks going down on a running total. As you can see the Dow Jones is going up, but the Advance/decline is going DOWN. This means only a few stocks are going up. If this doesn’t change, the market could be ready for a little decline There is trend-line support at 28400 if it drops there. But unless the indicators change for the better, the market may fall and correct somewhat.
The NASDAQ is above. As you can see the NASDAQ is going up and is at the upper part of channel with-overbought and oversold indicators like the SK-SD stochastic indicators (the first graph) are very overbought. When the horizontal blue line is above 88 where the indicators are currently the market is overbought. Many times, when this indicator is above 88 you will see some sort of a correction or a give back.
See the last three times this indicator hit this level and crossed below it, the market fell. The NASDAQ can fall to the 8900 level where the bold trend line is above and still be bullish. It’s when we break that dark blue trend-line, then I will get very Cautious. Right now, the NASDAQ is overbought, and there are only a few stocks pushing this market higher. The third graph is the Advance decline Line. Notice, as the NASDAQ is going higher, it is going higher on a few stocks, that is why the Advance Decline Line is falling.
What is the Advance-Decline Line?
The advance/decline line (A/D) is a technical indicator that plots the difference between the number of advancing and declining stocks daily. The indicator is cumulative, with a positive number being added to the prior number, or if the number is negative, it is subtracted from the prior number.
The A/D line is used to show market sentiment, as it tells traders whether more stocks are rising or falling. It is used to confirm price trends in major indexes, and can also warn of reversals when divergence occurs.
The on-balance volume (OBV) is a technical analysis indicator intended to relate price and volume in the stock market. OBV is based on a cumulative total volume.[1] Money flow is calculated by averaging the high, low and closing prices, and multiplying by the daily volume. Comparing that result with the number for the previous day tells traders whether money flow was positive or negative for the current day. Positive money flow indicates that prices are likely to move higher, while negative money flow suggests prices are about to fall.
Source: Investopedia
A Support or support level is the level at which buyers tend to purchase or into a stock or index. It refers to the stock share price that a company or index should hold and start to rise. When the price of the stock falls towards its support level, the support level holds and is confirmed, or the stock continues to decline, and the support level must change.
Support levels on the S&P 500 area are 3248, 3217 area MAJOR Trend line support, 3182, 3119, and 3088. These might be BUY areas.
Support levels on the NASDAQ are 8900, 8655, and 8474.
On the Dow Jones support is at 28,420, 28245, 26093 (200-day moving average) and 27764
These may be safer areas to get into the equity markets on support levels slowly.
RESISTANCE LEVEL ON THE S&P 500 3280.
THE BOTTOM LINE:
The market is somewhat overbought and at FAIR VALUE. There are now some cracks in the dam showing as explained above, but my computer systems are still at a Hold for the market direction. I expected the S&P to hit 3280, it did last week and sold off very quickly to the 2165 area. The markets are rallying on large-cap growth and technology stocks and watching the other smaller to midcap companies decline. Either we start to see the small and midcap stocks begin to rally, or the market could begin to decline. The S&P could hit 3280 to 3400 later in the year. Earnings could potentially grow 6 to 7% or more this year and that is why there is the possibility that the S&P 500 could reach 3280 to 3400+ in 2020, a much smaller rise in the stock market than in 2019 but hopefully, a decent return, with obviously no guarantees expressed or implied.
Best to all of you,
Joe Bartosiewicz, CFP® Investment Advisor Representative 5 Colby Way Avon, CT 06001 860-940-7020 or 860-404-0408
SECURITIES AND ADVISORY SERVICES OFFERED THROUGH SAGE POINT FINANCIAL INC., MEMBER FINRA/SIPC, AND SEC-REGISTERED INVESTMENT ADVISOR.
Charts provided by AIQ Systems:
Technical Analysis is based on a study of historical price movements and past trend patterns. There is no assurance that these market changes or trends can or will be duplicated shortly. It logically follows that historical precedent does not guarantee future results. Conclusions expressed in the Technical Analysis section are personal opinions: and may not be construed as recommendations to buy or sell anything.
Disclaimer:
The views expressed are not necessarily the view of Sage Point Financial, Inc. and should not be interpreted directly or indirectly as an offer to buy or sell any securities mentioned herein. Securities and Advisory services offered through Sage Point Financial Inc., Member FINRA/SIPC, an SEC-registered investment advisor.
Past performance cannot guarantee future results. Investing involves risk, including the potential loss of principal. No investment strategy can guarantee a profit or protect against loss in periods of declining values. Please note that individual situations can vary. Therefore, the information presented in this letter should only be relied upon when coordinated with individual professional advice. *There is no guarantee that a diversified portfolio will outperform a non-diversified portfolio in any given market environment. No investment strategy, such as asset allocation, can guarantee a profit or protect against loss in periods of declining values. It is our goal to help investors by identifying changing market conditions. However, investors should be aware that no investment advisor can accurately predict all of the changes that may occur in the market. The price of commodities is subject to substantial price fluctuations of short periods and may be affected by unpredictable international monetary and political policies. The market for commodities is widely unregulated, and concentrated investing may lead to Sector investing may involve a greater degree of risk than investments with broader diversification. Indexes cannot be invested indirectly, are unmanaged, and do not incur management fees, costs, and expenses.
Dow Jones Industrial Average: A weighted price average of 30 significant stocks traded on the New York Stock Exchange and the NASDAQ. S&P 500: The S&P 500 is an unmanaged indexed comprised of 500 widely held securities considered to be representative of the stock market in general.
NASDAQ: the NASDAQ Composite Index is an unmanaged, market-weighted index of all over the counter common stocks traded on the National Association of Securities Dealers Automated Quotation System (IWM) I Shares Russell 2000 ETF: Which tracks the Russell 2000 index: which measures the performance of the small capitalization sector of the U.S. equity market.
A Moderate Mutual Fund risk mutual has approximately 50-70% of its portfolio in different equities, from growth, income stocks, international and emerging markets stocks to 30-50% of its portfolio in different categories of bonds and cash. It seeks capital appreciation with a low to moderate level of current income.
The Merrill Lynch High Yield Master Index: A broad-based measure of the performance of non-investment grade US Bonds MSCI EAFE: the MSCI EAFE Index (Morgan Stanley Capital International Europe, Australia, and Far East Index) is a widely recognized benchmark of non-US markets. It is an unmanaged index composed of a sample of companies’ representative of the market structure of 20 European and Pacific Basin countries and includes reinvestment of all dividends. Investment grade bond index: The S&P 500 Investment-grade corporate bond index, a sub-index of the S&P 500 Bond Index, seeks to measure the performance of the US corporate debt issued by constituents in the S&P 500 with an investment-grade rating. The S&P 500 Bond index is designed to be a corporate-bond counterpart to the S&P 500, which is widely regarded as the best single gauge of large-cap US equities.
Floating Rate Bond Index is a rule-based, market-value weighted index engineered to measure the performance and characteristics of floating-rate coupon U.S. Treasuries, which have a maturity greater than 12 months. Money Flow; The Money Flow Index (MFI) is a momentum indicator that measures the flow of money into and out of a security over a specified period. It is related to the Relative Strength Index (RSI) but incorporates volume, whereas the RSI only considers SK-SD Stochastics. When an oversold stochastic moves up through its MA, a buy signal is produced. Furthermore, Lane recommends that the stochastic line be smoothed twice with three-period simple moving averages: SK is the three-period simple moving average of K, and SD is the three-period simple moving average of SK
Rising Wedge; A rising wedge is a technical indicator, suggesting a reversal pattern frequently seen in bear markets. This pattern shows up in charts when the price moves upward with pivot highs and lows converging toward a single point known as the apex
The last month has been very good for the stock market. With the stock indexes rallying 25% or more this year, the market is now at fair value. This means that even though I feel the market could rise next year to my potential forecast of 3280 to 3380, the market based on this year’s earnings is currently where it should be. Barring any Trump slump in the impeachments or Chinese tariffs blow ups, the markets could sell off in the first part of 2020 but if earnings grow 6-7% and interest rates stay low then any market sell off should be just a correction and nothing more than a 4-7% selloff possibly. But because some hedge fund managers are underperforming the S&P 500 this year, any sell off over the next week or so maybe shallow as they want to show their investors at the end of the year that they were fully invested. Beware of a possible sell off after January 2, 2020.
An excerpt from Fundamental Economist Dr. Robert Genetski: from Classical Principles.com:
Stocks rebounded this past week with gains in the vicinity of 2%. The S&P500, Nasdaq and Nasdaq 100 hit new all-time record highs. Christmas came early for investors as trade agreements with China and with Democrats over the USMCA appear wrapped up. The USMCA trade agreement is not a major move in the direction of free trade. It involves only minor adjustments to trade affecting relatively few industries. The main benefit of the agreement is it reduces the uncertainty businesses face over the potential for a major disruption in trade. While details of the agreement with China are not yet available, the main benefit of an agreement will be to reduce uncertainty. This makes it easier for businesses to plan for the future. The resolution of key trade issues and the Fed’s purchases of securities mean the immediate outlook for both the economy and stocks remains positive. Stay bullish.
Longer-term interest rates should remain in the present vicinity for the immediate future.
On the Technical Side:
In November the S&P 500 broke out of the Ascending Triangle that was very Bullish. Now that the S&P 500 is at 3169 and at Fair value it would be normal to see a little correction that I don’t see until the first quarter of next year possibly.
Interest Outlook:
I see the Federal Reserve remaining stable with interest rates.
Some of the INDEXES of the markets both equities and interest rates are below. The source is Morningstar.com up until December 13th, 2019. These are passive indexes.
Dow Jones +23% S&P 500 +27% NASDAQ Aggressive growth +34% I Shares Russell 2000 ETF (IWM) Small cap +23% International Index (MSCI – EAFE ex USA) +19% Moderate Mutual Fund +16% Investment Grade Bonds (AAA) Long duration +13% High Yield Merrill Lynch High Yield Index +12% Floating Rate Bond Index +3-5% Short Term Bond +3% Fixed Bond Yields (10 year) +1.80.% Yield The average Moderate Fund is up 16% this year fully invested as a 65% in stocks and 35% in bonds and nothing in the money market.
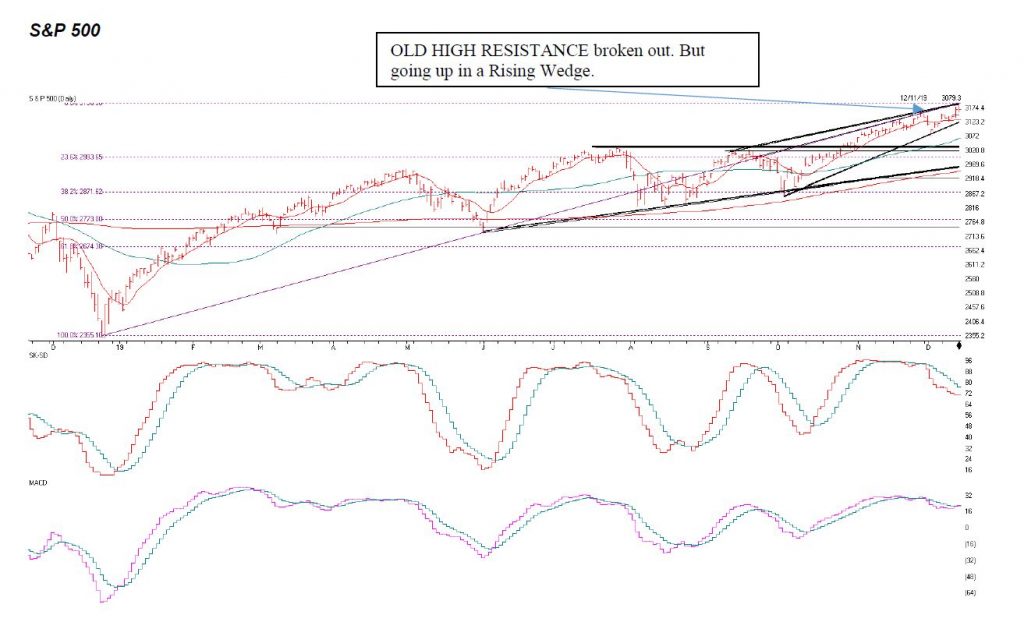
S&P 500
Source: AIQ Systems on graphs
The S&P 500 is above. I thought it would break out in October and it did and continued in November and December, but now it needs to Breakout ABOVE and close above 3190 to 3195 or it tops out here. There is a Rising Wedge that I am pointing to above. These tend to be topping and reversal patterns. So watch for a continuation of the breakout above 3190-3195 or it can stall here. If the S&P 500 closes below 3120 I will be getting Cautious. The 50 Day moving average at 3063 should find some Buying support. But the 3030 level is Key Support. If it is closes below 3120 I get Cautious, this means reduce exposure in equities a little if it closes below there. If it closes below the 50 Day Moving average of 3063 I may want to reduce a little more. And a Close below 3030 gets me Very Cautious.
I like the Midcap and some of the smaller stocks and the international and emerging markets going into next year and a reduction of the ULTRA large companies as they are fairly valued.
The first indicator above is the SK-SD Stochastic indicator. This shows the market is a little overbought on a weekly basis but not tremendously overbought.
The second Indicator is the MACD or Moving Average Convergence Divergence Indicator. This is breaking out on the upside showing that the market is gaining its upward momentum again.
Also On-Balance on a monthly total is at new highs in the Dow Jones. This is also Bullish.
OLD HIGH RESISTANCE broken out. But going up in a Rising Wedge.
Support levels on the S&P 500 area are 3154, 3124, 3030, 3017 and 2966. These might be BUY areas.
Support levels on the NASDAQ are 8588, 8348, 8253, 8136 and 8019.
On the Dow Jones support is at 27,667, 27,389, and 27,269 and 26,726
These may be safer areas to get into the equity markets on support levels slowly.
RESISTANCE LEVEL ON THE S&P 500 3190-3195. We need a break of 3195 to void the Rising Wedge.
THE BOTTOM LINE:
The market has rallied a great deal this year after a moderately down 2018. We have made a nice gain this year depending on how aggressive you were in your portfolio. The 3130-3180 I called earlier in the year to reach hit its target at 3169 as of Friday, but it should be reasonably ok and going into the end of December, but I expect a little correction earlier in the first part of 2020 but if everything goes well in our favor with the Chinese Tariffs then earnings could potentially grow 6 to 7% or more and there is possibility that the S&P 500 could reach 3280 to 3380 in 2020, a much smaller rise in the stock market than in 2019 but hopefully a decent return, with obvious no guarantees expressed or implied.
Best to all of you,
Joe
Joe Bartosiewicz, CFP®
Investment Advisor Representative
5 Colby Way
Avon, CT 06001
860-940-7020 or 860-404-0408
SECURITIES AND ADVISORY SERVICES OFFERED THROUGH SAGE POINT FINANCIAL INC., MEMBER FINRA/SIPC, AND SEC-REGISTERED
INVESTMENT ADVISOR.
Charts provided by AIQ Systems:
Technical Analysis is based on a study of historical price movements and past trend patterns. There is no assurance that these market changes or trends can or will be duplicated shortly. It logically follows that historical precedent does not guarantee future results. Conclusions expressed in the Technical Analysis section are personal opinions: and may not be construed as recommendations to buy or sell anything.
Disclaimer: The views expressed are not necessarily the view of Sage Point Financial, Inc. and should not be interpreted directly or indirectly as an offer to buy or sell any securities mentioned herein. Securities and Advisory services offered through Sage Point Financial Inc., Member FINRA/SIPC, an SEC-registered investment advisor.
Past performance cannot guarantee future results. Investing involves risk, including the potential loss of principal. No investment strategy can guarantee a profit or protect against loss in periods of declining values. Please note that individual situations can vary. Therefore, the information presented in this letter should only be relied upon when coordinated with individual professional advice. *There is no guarantee that a diversified portfolio will outperform a non-diversified portfolio in any given market environment. No investment strategy, such as asset allocation, can guarantee a profit or protect against loss in periods of declining values.
It is our goal to help investors by identifying changing market conditions. However, investors should be aware that no investment advisor can accurately predict all of the changes that may occur in the market.
The price of commodities is subject to substantial price fluctuations of short periods and may be affected by unpredictable international monetary and political policies. The market for commodities is widely unregulated, and concentrated investing may lead to Sector investing may involve a greater degree of risk than investments with broader diversification.
Indexes cannot be invested indirectly, are unmanaged, and do not incur management fees, costs, and expenses.
Dow Jones Industrial Average: A weighted price average of 30 significant stocks traded on the New York Stock Exchange and the NASDAQ.
S&P 500: The S&P 500 is an unmanaged indexed comprised of 500 widely held securities considered to be representative of the stock market in general.
NASDAQ: the NASDAQ Composite Index is an unmanaged, market-weighted index of all over the counter common stocks traded on the National Association of Securities Dealers Automated Quotation System (IWM) I Shares Russell 2000 ETF: Which tracks the Russell 2000 index: which measures the performance of the small capitalization sector of the U.S. equity market.
A Moderate Mutual Fund risk mutual has approximately 50-70% of its portfolio in different equities, from growth, income stocks, international and emerging markets stocks to 30-
50% of its portfolio in different categories of bonds and cash. It seeks capital appreciation with a low to moderate level of current income.
The Merrill Lynch High Yield Master Index: A broad-based measure of the performance of non-investment grade US Bonds
MSCI EAFE: the MSCI EAFE Index (Morgan Stanley Capital International Europe, Australia, and Far East Index) is a widely recognized benchmark of non-US markets. It is an unmanaged index composed of a sample of companies’ representative of the market structure of 20 European and Pacific Basin countries and includes reinvestment of all dividends.
Investment grade bond index: The S&P 500 Investment-grade corporate bond index, a sub-index of the S&P 500 Bond Index, seeks to measure the performance of the US corporate debt issued by constituents in the S&P 500 with an investment-grade rating. The S&P 500 Bond index is designed to be a corporate-bond counterpart to the S&P 500, which is widely regarded as the best single gauge of large-cap US equities.
Floating Rate Bond Index is a rule-based, market-value weighted index engineered to measure the performance and characteristics of floating-rate coupon U.S. Treasuries, which have a maturity greater than 12 months.