September 12, 2020
Hello Everyone,
I hope all of you had a nice summer. It was definitely different from what we are used too to say the least. Covid 19 has positively changed our lives and businesses in so many ways. With 6.7 million cases and 200,000 deaths reported the USA, businesses are doing business differently than we are accustomed too. To keep us safe we are using the phone, Zoom, DocuSign, the fax and scanning more than we ever did. In addition we are using online services more as well. This is definitely hurting much of the economy that relies on people going to the malls, restaurants, stores, and other “nonessential” businesses. Restaurants are coming back a little but not that much, and most business traffic is down significantly from one year ago. Resort, cruise ship, hotel and airline traffic are way down as well. But, the technology sector as people are using their home office and staying home playing games and online shopping is up tremendously. This will continue for as long as Covid 19 is present. As the hopes of a vaccine over the next 6 to 8 months become apparent the normal economy should strengthen and people will start to travel more, go to their offices and use all the services they did prior to Covid 19. It will take some time but when things go back to the norm, and there is a safe and effective vaccine that won’t give you other diseases I think most businesses will come back, but not all of them. Has the consumer changed during the Covid pandemic? Yes, their habits have changed and some businesses will go away and new ones will emerge. The idea to investing is to keep an eye on the new emerging businesses and possibly invest in those that could have long term trend on the upside.
This year more than two thirds of all S&P stocks are down for the year. That is why the Equal weighted S&P is down 5% for the year. The equal weighted S&P 500 means that every stock will have a 0.2% weighting as opposed to the tech stocks like Apple having a 6%+ weighting. That is why the S&P 500 is up 4.4%. It’s because stocks like Apple, Amazon and Microsoft going up so much this year and have skewed the indexes and have us believe that the market is doing better than it is. Tech is doing well and they represent the largest market value in the S&P 500 but most of the S&P stocks are down for the year.
CURRENT TRENDS:
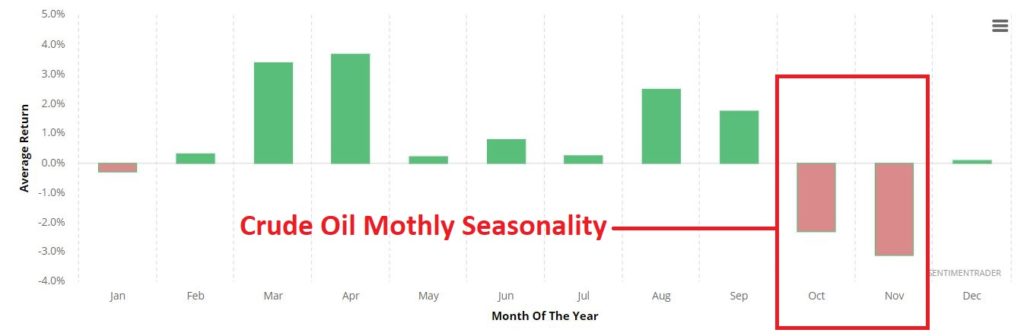
We are now in the part of the year where seasonal weakness on the stock market happens. Between mid to late August and October the stock market, historically has been weak. It’s not guaranteed but my computer models went to Sell signals a week or so ago, and caution over the short term is now appropriate. This doesn’t mean to sell everything, no, maybe realign your allocation and sell some depending on your time, risk tolerance, and goals. The market between now and after the election could get more volatile. This Monday if the main indexes (S&P; Dow; NASDAQ) fall below the 50 day moving average I will have a much more negative outlook.
As you can see below the only thing that is up is the tech sector that’s in the NASDAQ, and the market weighted S&P for the most part. It’s all about technology that is used at home for business and leisure.
Some of the INDEXES of the markets both equities and interest rates are below. The source is Morningstar.com up until September 12, 2020.
Dow Jones -2.2%
S&P 500 +4.4%
EQUAL WEIGHTED S&P 500 –5.0%
NASDAQ Aggressive growth +27%
Large Cap Value -9.3%
I Shares Russell 2000 ETF (IWM) Small cap -9.0%
Midcap stock funds -9-11.-12%
International Index (MSCI – EAFE ex USA -4.2%
Financial stocks -18%
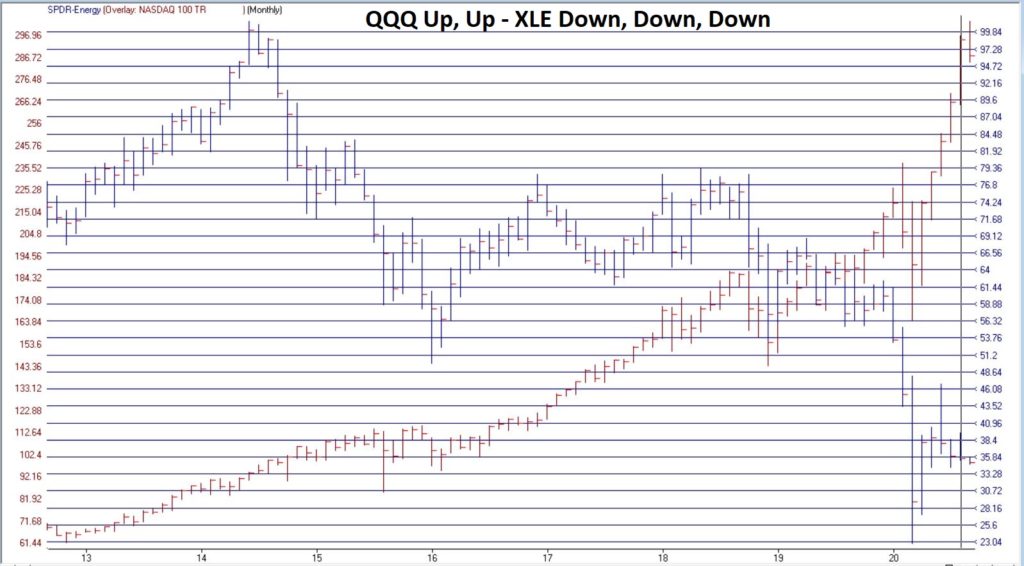
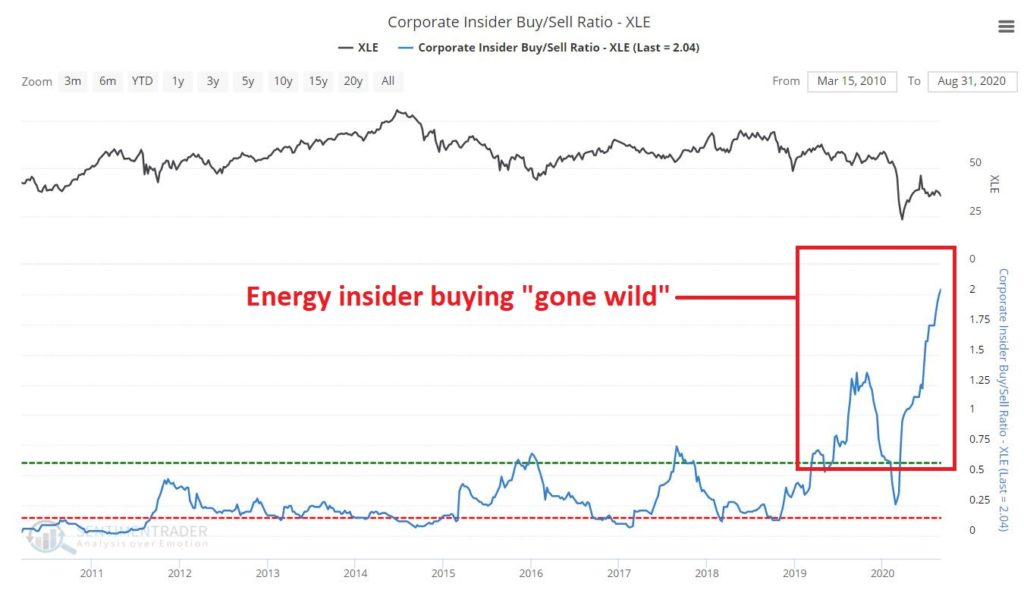
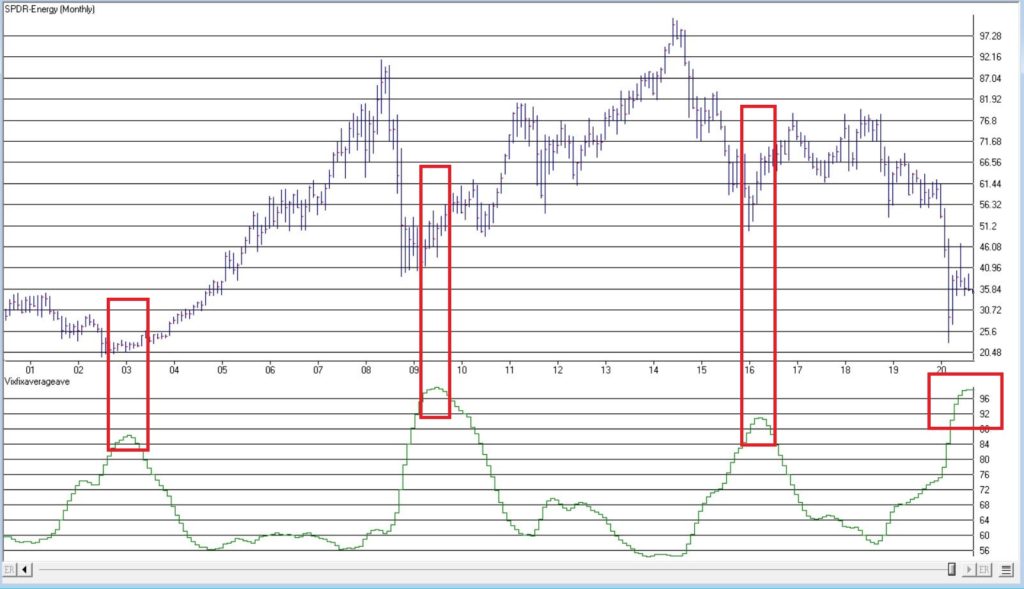
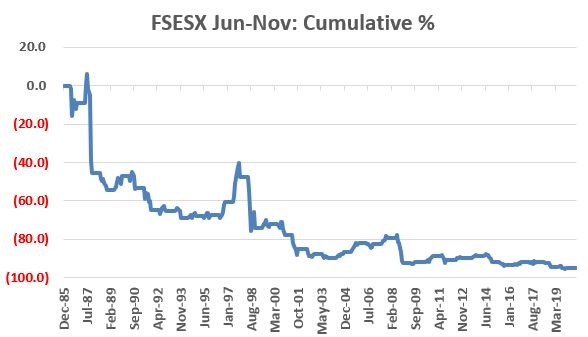
Energy stocks -43%
Healthcare Stocks +3.6% Moderate Mutual Fund Investment Grade Bonds (AAA) Long duration –3.56%
High Yield Merrill Lynch High Yield Index -0.5% Floating Rate Bond Funds -1.9%
Short Term Bond +1.6%
Fixed Bond Yields (10 year) .67% Yield
Classicalprinicples.com and Robert Genetskis Excerpts:
Market Outlook
The correction in stock prices continued this past week as the NASDAQ and QQQs fell 5%. They are both down roughly 10% off their highs of just over a week ago. The Dow, S&P500, and small caps fell 2%-3% as the market continues to consolidate. On a positive note, the declines brought all major indexes back it the vicinity of their 50-day moving averages. The steep decline in the Nasdaq brought it back from an extremely overvalued position. The S&P500 is now fairly valued. There was no significant news moving the market. Rather, it appears the market got ahead of itself and is now back on track. While the market will do what it will do, I expect the most likely course will be a leveling off close to its current position. This is not a time for aggressive buying or selling, but a time to stay put.
A Look Back
This week’s Inflation numbers provided the only economic news. Consumer prices in August continued to rebound rising at a 4% rate for the third consecutive month. The year over year increases are still below 2%. Surprisingly, even though commodity prices rose sharply, wholesale prices of finished goods ticked down. Go figure. Unemployment news was mostly unchanged in the latest week. Initial claims for unemployment insurance were unchanged at 884,000 in the first week of September. This is just over a million fewer claims than in August. Unemployment insurance payments in August went to 14 million workers, 3 million less than in July. While the economy has recovered rapidly, there were still 14 million unemployed in August.
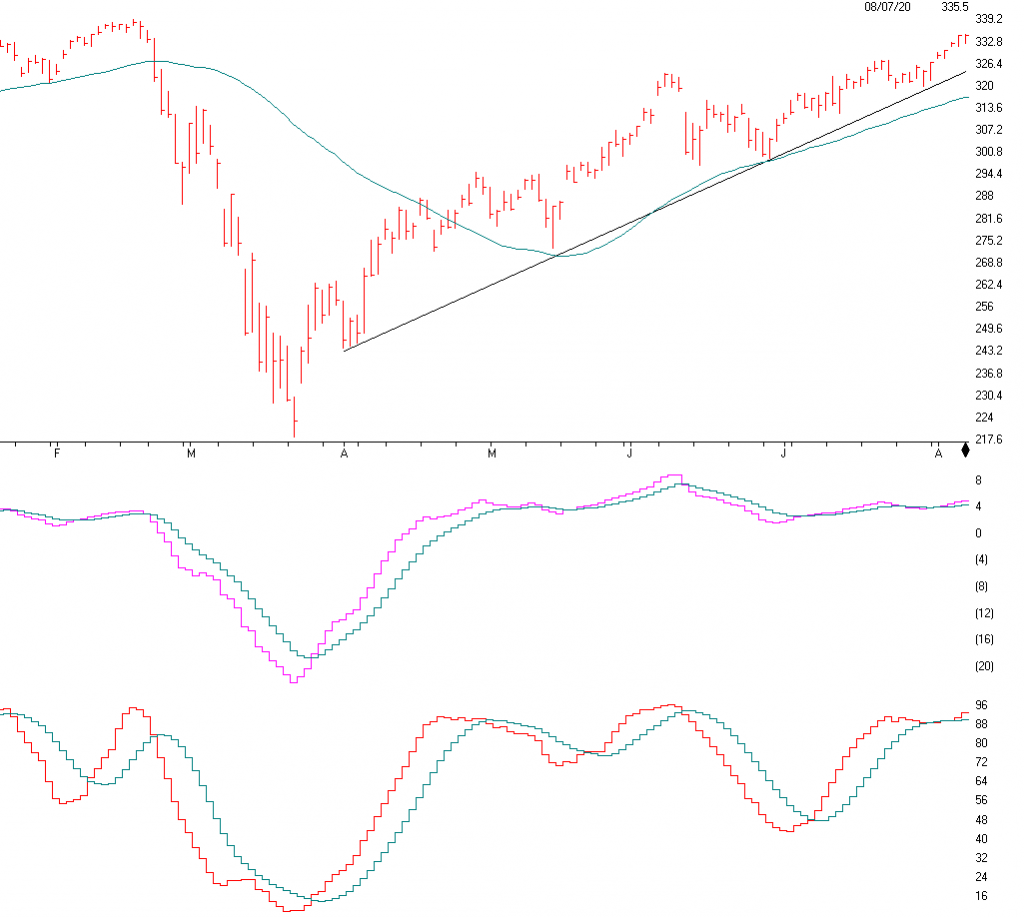
The S&P is above. This is the Market Weighted S&P about which we refer.
Three things happened.
- The S&P broke the upward trend line. This is negative
- We are just above the 50 Day moving Average.
- It is right at support of the breakout in July
What this means to me and this is not guaranteed is that if the S&P has a big down day and CLOSES below 3263 it would set us up for a longer decline and correction in the market, The NASDAQ closed below the 50 day moving average Friday. If the market doesn’t go up and stay up Monday or Tuesday then in my opinion there should be more downside. The MACD or momentum index has crossed below the signal Sell line. The SD-SD Stochastics has crossed below the signal line but the short term Stochastics has gone to a short term oversold level. So we could have a bounce right here.
I am very concerned about the crossing and closing below the 50 day moving average. So a decisive break and close below the 50 moving average is very important and not a good thing. We are not there yet.
This is the short term daily chart. This shows more short term volatility. Longer term the market still long okay and is still in an upward trend.
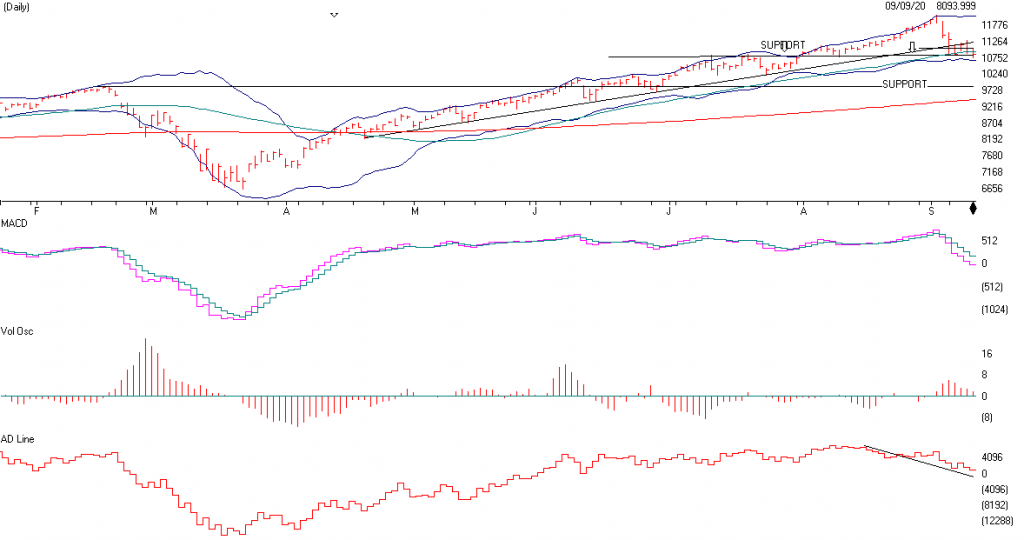
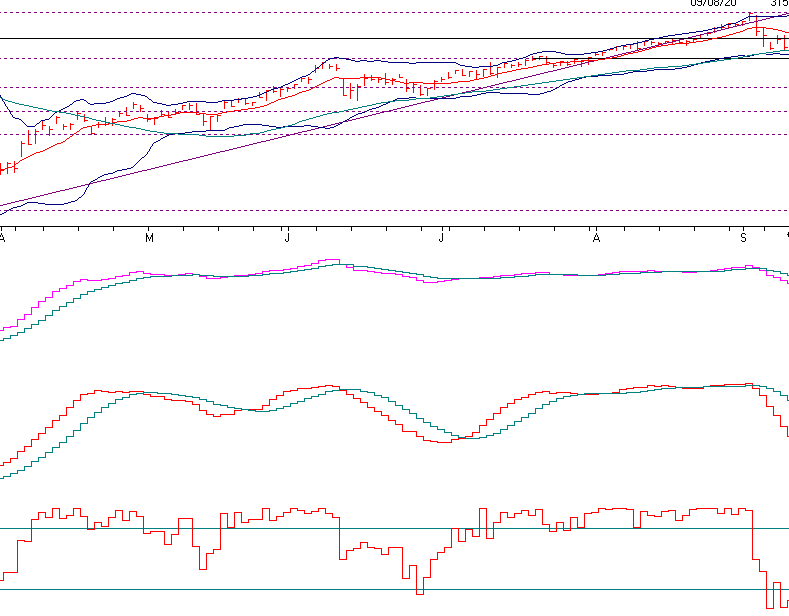
The NASDAQ and the tech stocks have been the big winner this year by a longer shot. With most stocks down for the year, the tech stocks like Apple, Microsoft, Amazon, Zoom and more have clearly been the big winners and leaving the other 905 of stocks in the dust. As you can see to the left, the NASDAQ is above the highs reached in February while the S&P and the Dow are below the highs in February. The NASDAQ is now of concern. Look to the left as you will see three things. I will point them out.
- The Trend-line that started in April is now broken
- The 50 Day moving Average was violated Friday. Negative
- The NASDAQ better not break the SUPPORT level of 10822, and is only 30 points below. If it does, there is no SUPPORT until 9839 on the NASDAQ, then 9457, the 200 Day Moving Average.
Momentum has broken down as seen by the pink line dipping below the blue line. In addition Volume has picked up as the NASDAQ fell.
Lastly, the Advance Decline Line has been negative while the NASDAQ has gone higher. See the NASDAQ go higher as most stocks have fallen? This is not a good sign and it shows that most stocks are going down while only a few large company stock are going higher.
I’m expecting a short term bounce here but the NASDAQ needs to stay above its 50 day moving average. In addition, the market is now in seasonal weakness. Going into October coupled with the upcoming election in November. This is not a time to get aggressive, but to take some stock or equity funds off the table.
The NASDAQ needs to stay above support and the 50 day moving average. If it doesn’t it should go lower.
Support levels on the S&P 500 area are 3321, 3101, 3054, and 2890.
These might be accumulation levels, especially 2649, or 2500. 2936 and 3015 are resistance.
Support levels on the NASDAQ are 10819, 10626, 9838 and 9419. Topping areas are 11,361 and 10000
On the Dow Jones support is at 27582, 27311, 26977 area and 26295. Then 24873.. Topping areas 28199 and 29211, these may be safer areas to get into the equity markets on support levels slowly on the accumulation areas.
THE BOTTOM LINE:
The market is up slightly over the last month. The tech sector that has been the stalwart is now cooling off and has broken and closed below its 50 day moving average and has also broken a 5 month trend-line. Further weakness in the NASDAQ and the S&P will happen unless the stock indexes go up on Monday and Tuesday and stay there. If this doesn’t happen quick then traders will start selling pushing this market lower. We are now in seasonal weakness for the stock markets between August and October. With the Election coming up in November more volatility should be at hand. If you are in or nearing retirement and your stock allocation is higher than normal for your goals you may want to rebalance or take a little off the table and reallocate to short term bonds or fixed accounts. I am still longer term Bullish on the market, but shorter term I am concerned about the stock market Trend-lines that are essential to hold. If they don’t hold, then there could be a setback to support the levels stated above. I still like the USA market better than the international one. When the vaccine actually shows promise the market should rebound.
Best to all of you,
Joe Bartosiewicz, CFP®
Investment Advisor Representative
92 High Street
Thomaston, CT 06787
860-940-7020
Charts provided by AIQ Systems:
Technical Analysis is based on a study of historical price movements and past trend patterns. There is no assurance that these market changes or trends can or will be duplicated shortly. It logically follows that historical precedent does not guarantee future results. Conclusions expressed in the Technical Analysis section are personal opinions: and may not be construed as recommendations to buy or sell anything.
Disclaimer: The views expressed are not necessarily the view of Sage Point Financial, Inc. and should not be interpreted directly or indirectly as an offer to buy or sell any securities mentioned herein. Securities and Advisory services offered through Sage Point Financial Inc., Member FINRA/SIPC, an SEC-registered investment advisor.
Past performance cannot guarantee future results. Investing involves risk, including the potential loss of principal. No investment strategy can guarantee a profit or protect against loss in periods of declining values. Please note that individual situations can vary. Therefore, the information presented in this letter should only be relied upon when coordinated with individual professional advice. *There is no guarantee that a diversified portfolio will outperform a non-diversified portfolio in any given market environment. No investment strategy, such as asset allocation, can guarantee a profit or protect against loss in periods of declining values.
It is our goal to help investors by identifying changing market conditions. However, investors should be aware that no investment advisor can accurately predict all of the changes that may occur in the market.
The price of commodities is subject to substantial price fluctuations of short periods and may be affected by unpredictable international monetary and political policies. The market for commodities is widely unregulated, and concentrated investing may lead to Sector investing may involve a greater degree of risk than investments with broader diversification.
Indexes cannot be invested indirectly, are unmanaged, and do not incur management fees, costs, and expenses.
Dow Jones Industrial Average: A weighted price average of 30 significant stocks traded on the New York Stock Exchange and the NASDAQ.
S&P 500: The S&P 500 is an unmanaged indexed comprised of 500 widely held securities considered to be representative of the stock market in general.
NASDAQ: the NASDAQ Composite Index is an unmanaged, market-weighted index of all over the counter common stocks traded on the National Association of Securities Dealers Automated Quotation System
(IWM) I Shares Russell 2000 ETF: Which tracks the Russell 2000 index: which measures the performance of the small capitalization sector of the U.S. equity market.
A Moderate Mutual Fund risk mutual has approximately 50-70% of its portfolio in different equities, from growth, income stocks, international and emerging markets stocks to 30-50% of its portfolio in different categories of bonds and cash. It seeks capital appreciation with a low to moderate level of current income.
The Merrill Lynch High Yield Master Index: A broad-based measure of the performance of non-investment grade US Bonds
MSCI EAFE: the MSCI EAFE Index (Morgan Stanley Capital International Europe, Australia, and Far East Index) is a widely recognized benchmark of non-US markets. It is an unmanaged index composed of a sample of companies’ representative of the market structure of 20 European and Pacific Basin countries and includes reinvestment of all dividends.
Investment grade bond index: The S&P 500 Investment-grade corporate bond index, a sub-index of the S&P 500 Bond Index, seeks to measure the performance of the US corporate debt issued by constituents in the S&P 500 with an investment-grade rating. The S&P 500 Bond index is designed to be a corporate-bond counterpart to the S&P 500, which is widely regarded as the best single gauge of large-cap US equities.
Floating Rate Bond Index is a rule-based, market-value weighted index engineered to measure the performance and characteristics of floating-rate coupon U.S. Treasuries, which have a maturity greater than 12 months.