This morning I want to do something different. For the past few weeks, I have been talking a lot about how I have mostly been scalp-trading stocks from the Honor Roll.
I have been doing more and more of this type of trading while I wait for the Ending Diagonal Pattern to complete and the market to top. I’ve been doing this because of the choppy nature of the Ending Diagonal, and also because I believe that there is way too much risk in the market now to be holding a lot of stock overnight. Scalp trading allows me to make a profit during the day, and then not have to worry about it evaporating overnight. I never hold positions overnight when I scalp.
So the first thing I want to show you this morning is my trading screen. The first slide shows you exactly what my trading screen looks like. It depicts the ThinkorSwim Trading Platform from TD Ameritrade. This platform is also available from several other brokers, so you don’t have to use Ameritrade. I’ve been using this trading platform for the past month because my AIQ Alerts Platform has been down temporarily as AIQ makes the change to its data provider.
Anyhow, as you can see from the first slide, all I do is set up my trading screen with a list of stocks that I’m interested in trading. I always have a few of the index ETF in the List, a few gold stocks and ETFs, and all of the recent stocks from the Honor Roll. This is my go to List. In other words, I don’t put a stock on the List if I’m not interested in trading it. I need to have a compelling reason for a stock to be on my List, and if there’s no compelling reason, the stock doesn’t make the cut. This is very important, because once the market opens and the battle begins, I know that every stock on my List is eligible to trade. I don’t have to think about any of these stocks or ETFs. I already decided that all are potential trades. So once the battle begins, all I need to make my buy or sell decision is for the indicators to line up.
OK, so now let’s look at the indicators I use to trigger the trades. I’m showing them on a 15 minute chart. The 15s and the 5s are the time periods I mostly use when I’m scalping.
On Wednesday, right after the Fed announcement, I was looking to scalp gold. So at 2pm, I had my trading platform set up to trade GDX. I figured that gold was poised to make a Big Move one way or the other. I just needed the indicators to tell me the direction. The Fed announcement was the compelling reason.
I also knew a Big Move was coming because the Bollinger Bands had narrowed going into the announcement. This is one of the first things I look for when I trade any stock. I ALWAYS want to see narrow Bands. I love to see them on a stock highlighted by Emeritus for the Honor Roll, because this tells me that the move can last for days or weeks. But even when I’m scalping, and don’t plan to hold the stock overnight, I still look for tight Bands. Remember, I’m not in this business just to hold stocks. NO, I only want to hold stocks when they are moving so I can make money. And when the Bands are tight, they tell me the stock is going to make a Big Move.
I’m not going to tell you how you should set-up your trading screen. Every trader has individual preferences. And depending on which platform you use, several of the indicators that I use are not available or calculated differently.
But basically, I ALWAYS have a DMI, a fast momentum indicator, a Money Flow indicator and a trend indicator on my trading screen. I only use indicators to trigger a trade. They are not used to identify potential trades. This is what I use my Lists for. By using Lists, I always know that there is a reason behind the stock or ETF. If it’s on the Dean’s List or Member’s Watch List, I know that it’s strong. If it’s on the Honor Roll, I know that it’s trending.
To trigger the trade I use a standard 14-period DMI, and a either a fast MACD (10-20-1) or a 10-period Momentum. The charts I’m showing today use a 10-period Momentum instead of the usual MACD. Both work well.
Same for the Money Flow. On my AIQ screen, I use my custom money flow indicator, but because this indicator is not available on the ThinkorSwim Platform, I use a 14-period Chaikin Money Flow.
I also put up a 35 period CCI. I use the CCI as a dual indicator. When I first enter long trade, I want to see it move above zero. Then once I’m in, I use it to tell me when the trend is over. So when I’m scalping, I usually start to manage money once the CCI moves below 100.
Anyhow, that’s pretty much it. So with this information, you might now want to look at the final two charts for NOC and TSCO. You also might want to look at several of the other stocks that have appeared recently on the Honor Roll. Almost all have the same characteristics.
One other thing you should pay attention to while you’re scalping is the overall direction of the market. In other words, pay attention to the cockpit indicators, like The Tide and both Coaches. If all of these indicators are positive, pay close attention to any stock highlighted as a long on the Honor Roll. After I see a stock highlighted, I look at it on a Daily Chart and try to determine why Emeritus put it on the Honor Roll. Does it have a recent Hockey Stick or TLB Pattern? Are the Bands narrow? If it does, I put it on my List. Same for the shorts. I need to see a pattern or tight Bands.
Then once the market opens, all I do is wait for the indicators to line-up. Once I’m in and have a profit, I start looking to protect it. Don’t be a hog! When you scalp, always remember that Bulls make money, Bears make money, and the Hogs get slaughtered!
The market pulled back on Friday in what appeared to be a move to form the Blade of a Hockey Stick that will be needed to push prices higher toward 18,350+. So if the market continues to pull back next week, look for the Bands to narrow as the Blade forms.
Then look for Emeritus to highlight stocks for the Honor Roll and scalp them on the shorter-term bars. Remember, this is NOT the time to be holding a lot of stock. There is way too much risk in the market now.
Have a great weekend.
That’s what I’m doing,
h
BTW, please let me know if you like this type of ‘Tactical Strategy’ in the WSR. I’m always interested in knowing what you want and need to help you learn. Remember, I only do this for you.
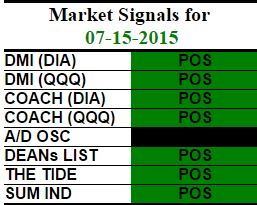
Market Signals for
06-22-2015 |
| DMI (DIA) |
NEG |
| DMI (QQQ) |
NEG |
| COACH (DIA) |
NEG |
| COACH (QQQ) |
POS |
| A/D OSC |
|
| DEANs LIST |
NEU |
| THE TIDE |
NEU |
| SUM IND |
NEG |
All of the commentary expressed in this site and any attachments are opinions of the author, subject to change, and provided for educational purposes only. Nothing in this commentary or any attachments should be considered as trading advice. Trading any financial instrument is RISKY and may result in loss of capital including loss of principal. Past performance is not indicative of future results. Always understand the RISK before you trade.