with Richard Muller, TradingExpert Pro user . Richard Muller senior instructor at The Trading Prism covers the current US market situation with trading signals from the AIQ Tradingexpert Pro software. He follows this with a sector rotation breakdown of the sectors leading and lagging the current market trend. Plus a look into money flow and other stock filters for possible option plays.
The Disciplined Trader
In this 40 minute recorded event from the City of London, Steve Hill, President of AIQ Systems and senior instructor at The Trading Prism, discusses the aspects of trading psychology that differentiate a successful trader from a failed trader. Successful traders don’t overcome fear and greed, they manage fear and greed to their advantage.
Trading With the Odds…
Steve Palmquist.Author of ‘The Timely Trades Letter’. ‘How to Take Money from the Markets’, and Money-Making Candlestick Patterns. New traders are often focused on what happens after they sell, or what happened to positions they did not take, or what happened if they would have ignored the the trading systems rules. This sort of focus develops bad habits that eventually cause problems. I want tools that are repeatable, I want tools that work more often than they fail, and then I just focus on using those tools in specific market environments where they have worked well. There is no technique that leads to profits on every trade. I have seen the adds for systems that work ’98% of the time’, but the guy selling them is the one making the money. Trading is a statistical business, and traders find tools that have a good percentage of success and use them in appropriate market conditions. Traders make their money by testing and analyzing tools and techniques in order to learn what actually works, and what just sounds good but does not lead to profits. A few examples can be very misleading, traders test their potential trading tools over many different trades in different types of market conditions. Trading an untested system is taking unknown risks and often just churns the account. Extensive testing has led to several practical trading techniques based on the Bollinger Bands. I have found that in most cases I am ahead in the long run to avoid trading when the market is extended above the upper Band. As indicated by the testing data shared in ‘How to Take Money From the Markets’, it is generally best to not initiate new positions when the market is extended above the upper Band. You can also see from just glancing at a two year chart of the NASDAQ that when the market becomes extended above the upper Band it most often pulls back, or trades sideways, for a few days in order to get back below the band. Trading should be data driven, not based on emotion, wishful thinking, or hot tips from TV hosts. To be data driven one needs to test and analyze trading tools and find out what really works, and when each tool should be used. Traders must understand which tool to use for a specific task, and have a clear understanding of how the tool works, and what can and cannot be done with it. I have extensively tested several trading systems, the results of this testing on specific trading trading tools are outlined in ‘How to Take Money from the Markets’, and Money-Making Candlestick Patterns. The testing process helps us understand how stocks usually behave after forming a specific pattern such as being outside the Bollinger Bands, showing strong distribution or accumulation, or pulling back or retracing during a trend. Understanding what a stock is most likely to do forms the beginning of a trading strategy. Trading without this information is taking unknown risks. Taking unknown risks can lead to disaster…
Finding Effective Trading Tools
Steve Palmquist.Author of ‘The Timely Trades Letter’. ‘How to Take Money from the Markets’, and Money-Making Candlestick Patterns. Trading is about risk management. In order to understand what the risks are traders need to understand exactly how and when their trading patterns work. Testing different tools, and understanding how each trading tool performs in different market conditions, is one way to get a clearer picture of what is an effective trading tool and how to use it. Identifying and developing trading systems with an edge is a lot of work. Making the trades is the easy part. Too many traders skip the analysis part and end up losing money because they have not put in the effort to develop trading tools that provide an edge. Trading some technique without having carefully tested and analyzed it generally leads to disappointment. The traders job is not to focus on making trades, but instead to focus on what types of patterns should be traded; and in which types of market conditions each trading tool works best. Trading should be data driven, not based on emotion, wishful thinking, or hot tips from TV hosts. To be data driven one needs to test and analyze trading tools and find out what really works, and when each tool should be used. Traders must understand which tool to use for a specific task, and have a clear understanding of how the tool works, and what can and cannot be done with it. I have extensively tested several trading systems, the results of this testing on specific trading trading tools are outlined in ‘How to Take Money from the Markets’, and Money-Making Candlestick Patterns. The testing process helps us understand how stocks usually behave after forming a specific pattern such as being outside the Bollinger Bands, showing strong distribution or accumulation, or pulling back or retracing during a trend. Understanding what a stock is most likely to do forms the beginning of a trading strategy. Trading without this information is taking unknown risks.
SWAMICHARTS
The AIQ code based on John Ehlers & Ric Way’s article in the march 2012 issue of Stocks & Comodities, “Introducing SwamiCharts,” is provided at www.TradersEdgeSystems.com/traderstips.htm.
Note that I did not attempt to replicate the SwamiCharts as displayed in Ehlers & Way’s article mainly because I am not a discretionary trader but rather focus on mechanical systems. I wanted to take the concept of multiple parameter sets for an indicator and see how this concept could be used in a trading system.
I decided to try a long-term trend-following system trading the NASDAQ 100 list of stocks using moving averages of various lengths. I created an indicator that uses five simple moving average lengths (10, 20, 50, 100, 200). If the close is above the moving average, then it gets a value of +1; otherwise, it gets a value of -1. I then simply sum the five values from the different lengths to create the SMA_SWAMI indicator. I then created a system with the indicator by entering long when the indicator is greater than or equal to 4 and exit when it drops to less than -4. I didn’t test the short side of the system, only the buy side. The code to test the short side is provided but was not tested.
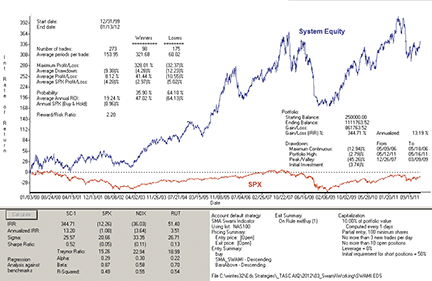
FIGURE 6: AIQ SYSTEMS, SMA_SWAMI SYSTEM.
Here is an equity curve for the theoretical SMA_SWAMI system compared
to the S&P 500 with the test statistics for the SMA_SWAMI system
trading the NASDAQ 100 list of stocks from 1/3/2000 to 1/13/2012.
In Figure 6, I show the equity curve and test statistics for the SMA_SWAMI system trading the NASDAQ 100 list of stocks from 1/3/2000 to 1/13/2012. The system averaged 13% compounded annual return with a maximum drawdown of 45% during the 2007–09 bear market.
This system is for illustrative purposes only and is not meant to be a finished system for live trading.
Again, the code and EDS file can be downloaded from www.TradersEdgeSystems.com/traderstips.htm. The code is also shown here:
!INTRODUCING SWAMI CHARTS
!Authors: John Ehlers and Ric Way, TASC March 2012
!System author: Richard Denning 1/15/2012
!Coded by: Richard Denning 1/15/2012
!www.TradersEdgeSystems.com
!Authors: John Ehlers and Ric Way, TASC March 2012
!System author: Richard Denning 1/15/2012
!Coded by: Richard Denning 1/15/2012
!www.TradersEdgeSystems.com
!INPUTS:
buyLvl is 4.
exitBuyLvl is -4.
sellLvl is -3.
exitSellLvl is 0.
C is [close].
sma10 is simpleavg(C,10).
sma20 is simpleavg(C,20).
sma50 is simpleavg(C,50).
sma100 is simpleavg(C,100).
sma200 is simpleavg(C,200).
sig10 is iff(C > sma10,1,-1).
sig20 is iff(C > sma20,1,-1).
sig50 is iff(C > sma50,1,-1).
sig100 is iff(C > sma100,1,-1).
sig200 is iff(C > sma200,1,-1).
SMA_SWAMI is sig10 + sig20 + sig50 + sig100 + sig200.
BarsAbove is countof(C > sma10,20).
buy if SMA_SWAMI >= buyLvl and valrule(SMA_SWAMI < buyLvl,1).
exitBuy if SMA_SWAMI < exitBuyLvl.
sell if SMA_SWAMI <= sellLvl.
exitSell if SMA_SWAMI > exitSellLvl.
—Richard Denning
This email address is being protected from spambots. You need JavaScript enabled to view it.
for AIQ Systems