I was looking through some old tradings scans the other day, and came across a really basic scan that still works well today. Here’s the nuts and bolts.
1. Look for stocks with todays volume that is twice the 21 days ESA of volume.
2. Close today has to be greater than the mid point between the high and low today.
3. The 14-day RSI Wilder today has to be less than 30.
4. Go long at next days open.
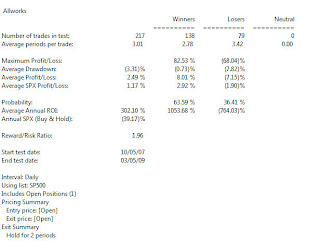
I tested this on Sp500 stocks with a simple holding period of 2 days, no other capital protection or exit strategy. Very interesting results. The test below was from 10/07/2007 – 03/05/2009. I wanted to cover a protracted pullback in the market (SP500 index was -39.17% for the period). The table below shows encouraging results.
The winners outnumbered the losers by 138 to 79 with an average profit/loss for all trades of 2.49%. Key points to note. With a holding period of 2 days, some positions take a big loss, some have hard drawdown (even in 2 days). You’d need a strong stomach to ride these positions. Scanning the positions in this strategy, there was one period where 25 new positions would have been established in one trading day. While not insurmountable, existing cash in an account would have been spread thinly if your capital was less than $50,000.
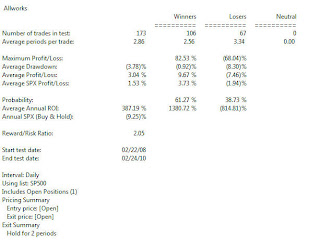
I ran this startegy for the last 24 months with similar results below. Again same key points on drawdown and new positions applied to this test.
In the next article, I’ll run this through the Portfolio Simulator with ‘real’ money for a complete real life test.


