Steve Palmquist.Author of ‘The Timely Trades Letter’. ‘How to Take Money from the Markets’, and Money-Making Candlestick Patterns.
I get emails from traders who just want to focus on swing trading, intermediate term trades, stock trades, or ETF trades. I am not sure how they have decided which is best, since the results of these different techniques can vary with market conditions. It makes more sense to have techniques for stock and ETF trading and be able to make swing trades and intermediate term trades and then adjust the relative account sizes based on what is working in the current market conditions.
Most of the recent ETF selections in the Letter have triggered and moved into profitable positions, which is why I rotated additional funds to the ETF account as noted in previous Letters. I want to move funds into what is working in the current environment. When the market is sluggish swing trading stocks slows down for obvious reasons. However even in sluggish markets we see some of the ETFs moving, so I put more focus there until the market finished resting and decides to move again. When the market is strongly trending there is usually more bang for the buck in swing trading stocks than ETFs so I rotate funds into the swing trading account. This sounds obvious, but sometimes traders get fixated on just one technique and don’t look at the bigger picture.
Adapting our trading tools and techniques to the current market conditions is one of the keys to trading success. Guessing the markets next move, or using the same trading tool (technique) all the time, can lead to poor results. By having swing trading and ETF trading accounts I have the ability to focus on trading ETFs when the market is sluggish and swing trading is slow. I can then move more into swing trading, with less focus on ETFs, when the market is strongly trending again. By just using one tool traders will have periods when they sit in cash for awhile waiting for the market to move.
In the current environment we see energy and commodities moving strongly (check out the strong profits from the recent GLD, OIL, XLP and SLV ETF trades as an example) Since we are seeing strong action in the energy and commodity areas I will look at a couple of swing trades of stocks in these areas if they trigger on increasing volume. There are a number of interesting setups in energy and commodity stocks like the ones in HMY, NFG, CVX, APA, and DVN. Given the markets recent positive volume pattern, shorts are not attractive unless the market starts showing strong distribution
The net change for the last six sessions is less than a one point movement, this is a very tight base. Tight bases often lead to strong moves, so while this is a time to keep the powder dry as noted in previous Letters. It is also a time to get the watch lists up to date and ready for the move that is coming. When the market, or individual stocks, approach a resistance area it is usually a good idea to focus on protecting profits made during the last run. When the market approaches resistance it usually bases or retraces a bit. If most of the time the market stalls, or retraces, around resistance then it is best to lock in some profits; and let the market set up for the next move. If the market breaks above resistance we will still have our profits and can take new positions. If the market retraces from resistance then we still have our profits, and will have avoided potential losses. If you hold when the market approaches resistance you risk losses if the market pulls back. For more market analysis and trading setups click here.
All posts by admin
IDENTIFYING CUP FORMATIONS EARLY
I have prepared the AIQ code based on Giorgos Siligardos’ article in the April issue of Stocks & Commodities magazine, “Identifying Cup Formations Early.” (The code can be viewed at www.Traders.com.) I devised a trading system using the Russell 1000 list of stocks to test the semi-cup formation as an entry technique. The trading rules for the system are as follows:
Entering a long position:
* Using a daily time frame, enter a long position when a semi-cup formation is first detected.
* Enter the next bar at the open using a market order.
Exiting a long position:
* Use a trailing 25% exit, or
* Protect 100% of a 15% or greater profit.
* Exit the next bar at the open using a market order.
Short positions were not tested.
In Figure 9, I show the results of simulated trading on the Russell 1000 stocks, using the following parameters:
1. Maximum positions per day = 3
2. Maximum total positions allowed = 10
3. Choose weakest candidates using 32-bar Aiq relative strength
4. Size each position at 10% of total account equity recomputed every day.

Figure 9: AIQ SYSTEMS, SAMPLE RESULTS FOR semi-cup formation SYSTEM. Here, a sample trading system using 76 actively traded NASDAQ stocks tests the semi-cup formation as an entry technique. For the test period 1/3/2000 to 1/6/2011, the average annual return was 18.8%, with a maximum drawdown of 68.8% on 11/20/2008.
For the test period 1/3/2000 to 1/6/2011, the average annual return was 18.8% with a maximum drawdown of 68.8% on 11/20/2008. Although the return is reasonably good, the maximum drawdown is larger than most could tolerate. With this in mind, I added a very simple market timing technique that added the following rules:
1. Longs can only be entered when the S&P 500 is trading above its 200-day simple moving average for two or more consecutive days.
2. Exit all positions when the S&P 500 falls below its 200-day simple moving average for two or more consecutive days.
For the test period 1/3/2000 to 1/6/2011, the average annual return was 10.1% with a maximum drawdown of 25.6% on 7/17/09 (see Figure 10). The drawdown was significantly reduced by the addition of the simple market timing technique. Although the average annual return was also reduced, the Sharpe ratio increased from 0.47 to 0.75, indicating a less risky approach.
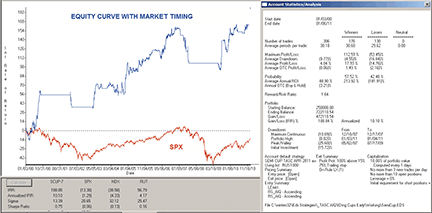
Figure 10: AIQ SYSTEMS, revised results with market timing added. For the refined semi-cup system, over the test period 1/3/2000 to 1/6/2011, the average annual return was 10.1% with a maximum drawdown of 25.6% on 7/17/09.
The AIQ code is available in an EDS file at http://aiqsystems.com/april2011cupandhandle.EDS
save the file to your /wintes32/EDS strategies folder
—Richard Denning
info@TradersEdgeSystems.com
for AIQ Systems
TIme Tested Trading TIps… March 19
Steve Palmquist.Author of ‘The Timely Trades Letter’. ‘How to Take Money from the Markets’, and Money-Making Candlestick Patterns.
I got a panicked email from a trader worried that the run ‘was over’ and he would not be able to trade long positions for ‘weeks’. First, the market moves in waves. It is normal for it to run up, then pull back then run up again. There is no way to know if a pullback will last a couple weeks, or a couple months. Secondly, traders can generate profits when the market is going up, or down. With the right set of tools it should not matter to a trader which way the market is going. Third, panic is incompatible with trading success. I just look at the markets price and volume pattern, form a trading plan that switches between different tools for different market conditions, and then implement the plan. Panic comes from ‘needing’ the market to go up, and not having a set of trading tools for different market conditions. The market does not care what we need or want, it will do what it wants. This is why we have different tools for different market conditions and switch between them based on what the market is doing. If the market direction is really, really important; it is usually a signal that the trader is using the ‘hold and hope’ approach rather than adapting to the market.
In order to trade confidently in different market conditions traders need to understand exactly how and when their trading patterns work. Testing different tools, and understanding how each trading tool performs in different market conditions, allows traders to make effective use of each tool in the trading toolbox. If traders have not tested their tools in different market conditions they are taking unknown risks. Back testing does not guarantee future results. There are no guarantees in trading, and no way to know if any particular trade will be profitable or not. Backtesting helps remove some of the emotion, hunches, and unknowns in trading. It can show you how a particular system has performed in different market conditions in the past and what types of filters may be most interesting in prioritizing trading opportunities. Examples of six complete trading systems and how they perform in different market conditions is covered in ‘How to Take Money from the Markets’. The knowledge of what to expect from a trading tool, and seeing how different trading tools perform in different markets allows traders to adapt to the market rather than just guessing what to do.
Steve is the author of two trading books: “Money-Making Candlestick Patterns, Backtested for Proven Results’, in which he shares backtesting research on popular candlestick patterns and shows what actually works, and what does not. “How to Take Money From the Markets, Creating Profitable Trading Strategies” in which he uses the results of extensive backtesting techniques to smash trading myths and get to the truth of what has worked and what has not. The book provides six fully analyzed and tested trading systems and shows how they have performed in different market conditions. Steve is the publisher of the, ‘Timely Trades Letter’ in which he shares his market analysis and specific trading setups for stocks and ETFs. To receive a sample of the ‘Timely Trades Letter’ send an email to sample@daisydogger.com. Steve’s website:www.daisydogger.com provides additional trading information and market adaptive trading techniques.
The Commodity Channel Index (CCI)
Some indicators work well in trending markets while others work in consolidating markets. The Commodity Channel Index (CCI) works best in strong trending markets. Unlike other trend following indicators, the CCI is designed to limit whipsaws during choppy markets.
Created by Donald Lambert, the CCI is a price momentum indicator that measures the degree of variance of a security’s price from its statistical mean. Although originally developed for trading commodities, the CCI can be used for equities or indexes as well.
AIQ has a default time period of 90-days in the calculation of the CCI. Time periods that are too short can lead to whipsaws while time periods that are too long result in missed signals. The 90-day time period seems to be a good compromise.
In general, the CCI looks at prices relative to the average price. If the CCI is high, then prices for that security are higher relative to its average price. Conversely, if the CCI of a security is low, then prices are lower than the average price.
In consolidating or sideways markets, the CCI tends to fall within the +/-100 range (the two horizontal lines on an AIQ chart). Whenever the CCI moves above or below this range, then it suggests a strong trend is in place. Therefore, when the CCI rises above +100 it suggests a strong
uptrend is underway and that long positions can be established. Long positions are closed once the CCI falls below +100. Conversely, when the CCI falls below –100 it means a downtrend is in place and short positions can be established. Short positions can be covered once the CCI rises above –100.
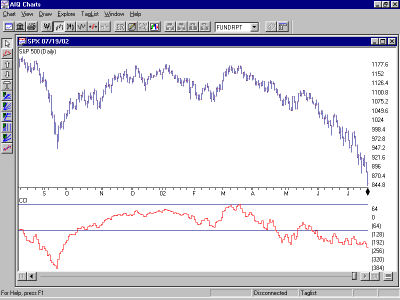
The chart above shows the S&P 500 along with its CCI indicator. Notice how this indicator was on a sell signal during the September sell-off. When the S&P 500 drifted sideways from November through April, the CCI was within the +100/-100 range so no signals were fired. This helped to avoid whipsaws. There was a brief sell signal when the CCI fell below –100 in late April and then another sell in late May.
Like other indicators, it is best to use the CCI in conjunction with other technical tools. Modifications to the simple buy/sell rules can be made as well. For instance, if the CCI has fallen to –170 and you have large profits on short positions, then it may be best to lock in some of the
profits rather than waiting for the indicator to rise above –100. Money management rules are important. Still, it is easy to see the value of the Commodity Channel Index indicator.
An Excerpt From the Timely Trades Letter…
Steve Palmquist.Author of ‘The Timely Trades Letter’. ‘How to Take Money from the Markets’, and Money-Making Candlestick Patterns.
I got an email from an excited trader last Tuesday, when the market was down forty five points. He had just taken large short positions because the ‘market was already down forty points and this was surely the end of the run’. The trading plan outlined in the Timely Trades Letter had us holding off on new trades unless the market broke above the ascending trend line drawn through the lows of 08/31 and 01/31; or moved below the 2670 area, which would set up a pattern of lower highs and lower lows. This trader ignored the trading plan and was trading on CNBC induced emotion. When the market popped up fifty points on Thursday the same trader was in a panic to close shorts and take longs ‘because the pullback was over’. Trading on emotion frequently results in losses.
The trading plan is based on how the market normally behaves. The idea of trading is to be positioned to profit if the market does the normal or usual thing in a given situation. Sometimes the market does unusual things, and then profits are not realized. However, by definition the market most often follows the normal path in a given situation; so that is the way to bet for long term success. In the current case the trend line break on 2/23 indicated that conditions were changing, but it does not indicate an immediate switch from up trend to down trend. Rather than guess what the market is up to, I just took my profits from the recent run on the trend line break and will now give the market a few days to set up again. Trying to consistently guess the markets next move is a losing game over the long run. A better bet is to protect profits while the market is in transition, and then pick up new trades when the market shows its hand. I trade what the market is telling us, not the opinions of the talking heads on TV.
After a trend line break the market may base for a bit, resume the up trend or start a new down trend. If the market is going to start a new down trend then it will by definition have to form a pattern of lower highs and lower lows. For this process to start we will need to see a break below the 2670 area. Until then the market is not in a down trend and short positions carry above average risk. New long positions also carry above average risk since the market just broke below an ascending trend line. The trading plan is to hold off on swing trades until the market picks a direction and either moves back above the ascending trend line or below the 2670 area.
The more traders understand exactly how and when their trading patterns work, the more effective use they will be able to make of each tool in the trading toolbox. Back testing does not guarantee future results. There are no guarantees in trading, and no way to know if any particular trade will be profitable or not. Backtesting helps remove some of the emotion, hunches, and unknowns in trading. It can show you how a particular system has performed in different market conditions in the past and what types of filters may be most interesting in prioritizing trading opportunities. Examples of six complete trading systems and how they perform in different market conditions is covered in ‘How to Take Money from the Markets’
Steve is the author of two trading books: “Money-Making Candlestick Patterns, Backtested for Proven Results’, in which he shares backtesting research on popular candlestick patterns and shows what actually works, and what does not. “How to Take Money From the Markets, Creating Profitable Trading Strategies” in which he uses the results of extensive backtesting techniques to smash trading myths and get to the truth of what has worked and what has not. The book provides six fully analyzed and tested trading systems and shows how they have performed in different market conditions. Steve is the publisher of the, ‘Timely Trades Letter’ in which he shares his market analysis and specific trading setups for stocks and ETFs. To receive a sample of the ‘Timely Trades Letter’ send an email to sample@daisydogger.com. Steve’s website:www.daisydogger.com provides additional trading information and market adaptive trading techniques.