Recording available for those who missed this event at http://connectpro39608568.adobeconnect.com/p3kcw8hmapq/
Richard Muller
Recording available for those who missed this event at http://connectpro39608568.adobeconnect.com/p3kcw8hmapq/
Richard Muller
 For those of you that are interested to hear my market update, I will be presenting the Iinvestors Business Daily monthly online meetup this coming Thursday January 10th at 7pm London time, 2pm eastern.
To attend use the link below
http://connectpro39608568.adobeconnect.com/ibdlondon/
I will also use the AIQ Expert Ratings analysis on the overall market to see which buy or sell signals are active, and where to next the market might be going.
Regards
Richard Muller
AIQ TradingExpert Pro user and Senior Instructor, The Trading Prism

OK, here’s what I see. First of all I see a stock that is in an Uptrend with its 50 > 200. However, the DMI is negative now and has been negative for the past 3 months. This is why I’m on the sidelines.
OK, so now after answering Yes to all of the questions, there appears to be a high probability that the triangle that took a full year to form was a correction of the Major Wave 3 up. So once it completes, the Major Wave 5 up should start.
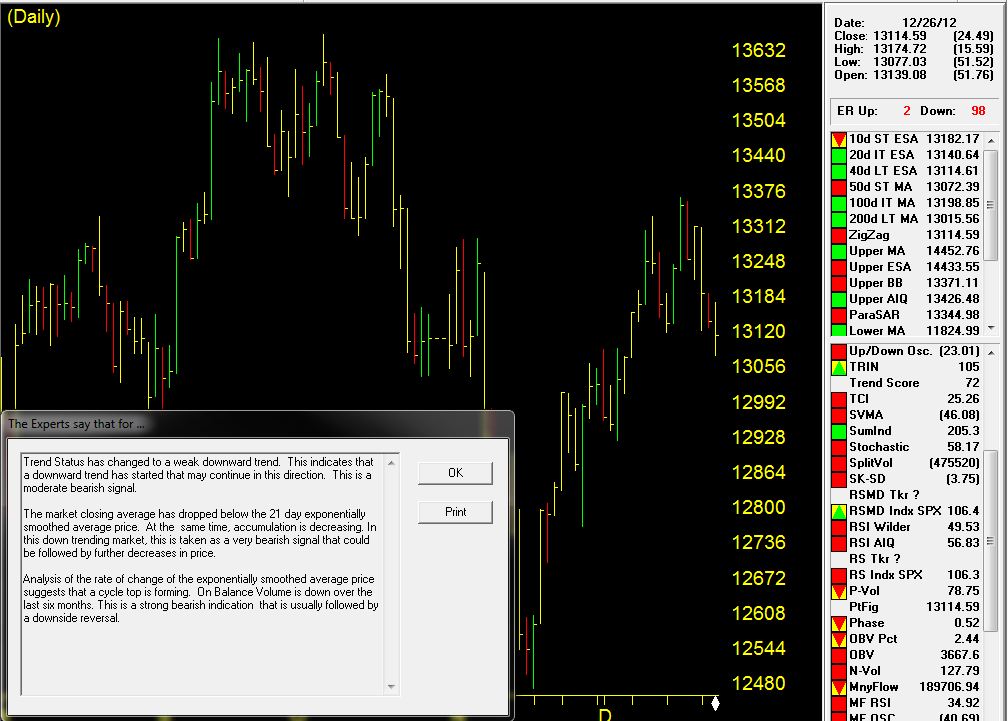
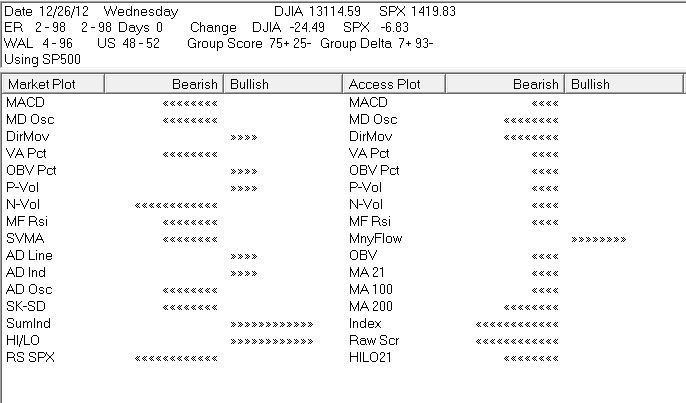
The Weighted Action List (WAL) a measure of tickers in the SP500 receiving confirmed Expert Ratings, is to the downside at 4-96. The Access Plot, a measure of the bullish/bearish for the sum of all SP500 stocks has only Moneyflow indicator in bullish territory.
We do not warrant, endorse or guarantee the
completeness, accuracy, integrity or timelines of the information in this post.
You must evaluate, and bear all risks associated with, the use of any
information provided hereunder, including any reliance on the accuracy,
completeness, safety or usefulness of such information. This information is not
intended to be used as the primary basis of investment decisions. It should not
be construed as financial or other advice or as an offer to sell or the
solicitation of an offer to buy any security.
|
UNTIL 12/31/2012
DON’T MISS OUT
AIQ Education Holiday Sale
Prices starting at just $3.95
Dale Wheatley option course on 4 DVDs –
The Secret to Extraordinary Wealth in the Options Market
When Dale spoke to the attendees, everyone’s full undivided attention was set on him. He revealed his system that utilizes the power of the MACD (Moving Average Convergence Divergence) indicator, which is the only indicator he uses and swears by because of its astounding results with less risk. As he cuts right to the chase, he laid out the charts and let the simple rules demonstrate how it works and what it is capable of doing for the traders in the room
$179  New Money-Making Trading Systems: Advanced Results from 6 Simple, Proven Strategies – Steve Palmquist
Long-term trading success is achieved using strategies that provide traders with an edge. But how can you prove that a system will show winning trades more often than random chance? You have to put it to the test. Don’t make costly mistakes by following the latest trading system blindly. Let Steve’s experience and expertise work for you. In this DVD course, he will not only provide you with six new powerful trading strategies, but he will show you exactly how to use each one to maximize profits.
$149 More bargains at ………….. |