A Series Of Indicators Used As One

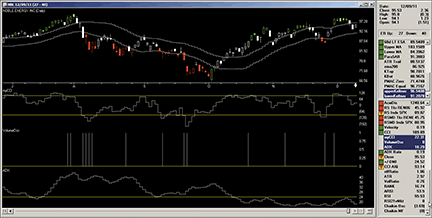
AIQ SYSTEMS, KELTNER CHANNELS, CCI, AND COLOR-CODED PRICE BARS. Here’s a sample chart of Noble Energy with the TMV indicators.
The AIQ code and EDS file based on is provided at www.TradersEdgeSystems.com/traderstips.htm. The code is also shown below
!TRADE BREAKOUTS AND RETRACEMENTS WITH TMV
!Author: Barbara Star,PhD, TASC February 2012
!Coded by: Richard Denning 12/9/2011
!www.TradersEdgeSystems.com
!CODING ABREVIATIONS:
C is [close].
C1 is valresult(C,1).
O is [open].
H is [high].
L is [low].
H1 is valresult(H,1).
L1 is valresult(L,1).
V is [volume].
!KELTNER CHANNEL
!INPUT:
keltLen is 20.
!KELTNER CHANNEL UDFs:
typ is (H+L+C)/3.
rangeAvg is simpleavg(H-L,keltLen).
!Plot the following three functions on price chart
!as three separte indicators:
midKelt is simpleavg(typ,keltLen).
upperKelt is midKelt + rangeAvg.
lowerKelt is midKelt – rangeAvg.
!ADX
!INPUT:
WilderLen is 10.
!NOTE: Wilder to expontential averaging the formula is:
!Wilder length * 2 -1 = exponential averaging length
!USED FOR DMI, ATR, ADX, ADX RATE
avgLen is WilderLen * 2 – 1.
!AVERAGE TRUE RANGE:
TR is Max(H-L,max(abs(C1-L),abs(C1-H))).
ATR is expAvg(TR,avgLen).
ATRpct is expavg(TR / C,avgLen) * 100.
!+DM -DM CODE:
rhigh is (H-H1).
rlow is (L1-L).
DMplus is iff(rhigh > 0 and rhigh > rlow, rhigh, 0).
DMminus is iff(rlow > 0 and rlow >= rhigh, rlow, 0).
AvgPlusDM is expAvg(DMplus,avgLen).
AvgMinusDM is expavg(DMminus,avgLen).
!DMI CODE:
PlusDMI is (AvgPlusDM/ATR)*100. !PLOT (2 lines)
MinusDMI is AvgMinusDM/ATR*100. !PLOT (2 lines).
DirMov is PlusDMI – MinusDMI.
DirMovAIQ is [dirMov].
!ADX INDICATOR as defined by Wells Wilder
!PLOT DIdiff as historigram is same as DirMov (AIQ built in indicator):
DIdiff is PlusDMI-MinusDMI.
ZERO if PlusDMI = 0 and MinusDMI =0.
DIsum is PlusDMI+MinusDMI.
DX is iff(ZERO,100,abs(DIdiff)/DIsum*100).
!PLOT ADX as single line indicator with support at 24:
ADX is expavg(DX,avgLen).
!VOLUME OSCILLATOR:
!INPUTS:
volLen1 is 1.
volLen2 is 20.
pctChgLvl is 50.
!VOLUME OSCILLATOR UDFs:
volAvg1 is simpleavg(V,volLen1).
volAvg2 is simpleavg(V,volLen2).
pctChgV is (volAvg1 / volAvg2 -1) * 100.
volOsc is iff(abs(pctChgV)>pctChgLvl,1,0). !PLOT
!CCI INDICATOR:
!INPUTS:
cciLen is 13.
!CCI UDFs:
typAvg is simpleavg(typ,cciLen).
absdiff is abs(typ-typAvg).
sumD is sum(absdiff,cciLen)/ cciLen.
CCI is (typ – typAvg) / (0.015 * sumD). !PLOT WITH +100 -100 LINES
!COLOR BAR RULES:
!INPUT:
trndLen is 8.
Green if ADX > valresult(ADX,1) and C > simpleavg(C,trndLen).
Red if ADX > valresult(ADX,1) and C < simpleavg(C,trndLen).
This e-mail address is being protected from spambots. You need JavaScript enabled to view it.
for AIQ Systems

