The Fibonacci time zones discussed in “Automated
Techniques For Intraday Traders” by Andrew Coles in this issue (August 2011 Stocks & Commodities) can be
implemented using the Fibonacci time zone chart tool in AIQ with no additional programming required.
Thus, I am instead providing code for the “Three Black Crows” candle pattern
that is discussed in Thomas Bulkowski’s June 2011 article, “Top
10 Candles That Work.”
Coding candlestick patterns requires quite a bit of interpretation, since
these patterns are described in relative terms like a “tall” candle or “closes
in the lower portion of the bar.” Depending on the interpretation given to these
relative terms, we can get different results. In my code set, shown below, I
provide inputs that allow for some of the adjustments. The three black crows
pattern has the following rules:
- Must have three tall candles in a row
- Pattern occurs in an uptrend and the first candle is the highest high
- The last two candles must open in the real body range of the prior candle
- All three must close near the low
- The last two candles must have lows that are lower than the prior low.
“Tall” means that the bars’ high–low range is greater than the 10-day average
range that occurs just prior to the start of the pattern. An uptrend is defined
as a linear regression slope of the closes greater than zero. “Closing near the
low” is based on how many candle zones are input, which are then used to divide
the range of the bar into zones. “Closing near the low” means that the close
must fall in the lowest zone. In addition, the author suggests testing in a bull
market. Bull market is defined here as when the 200-bar moving average
of the Standard & Poor’s 500 is greater than it was 10 bars ago. A bear
market occurs whenever it is not a bull market.
I tested the pattern by entering at the close on the day the pattern is
complete and exiting at the close six days later. This provides a test with five
overnights and five full bars held after the pattern completes. I used the
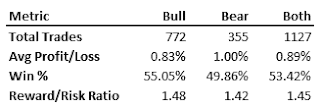
Russell 3000 list of stocks and tested from 1/15/1970 to 6/13/2011. In the table
in Figure 8, I show the comparative results of bull, bear, and combined bull and
bear. It appears that this pattern works in both bull and bear markets, but
there may not be enough signals to build a trading system from just this pattern
alone.
test period
The AIQ code is shown here and the Eds file for this technique can be downloaded from www.TradersEdgeSystems.com/traderstips.htm.
AIQ code for three black crows pattern

!TOP 10 CANDLES THAT WORK: THREE BLACK CROWS
!Author: Thomas N. Bulkowski, TASC June 2011
!Coded by: Richard Denning 6/14/11

!INPUTS:
RangeLen  is 10.
CandleZones  is 4.
HHLen   is 10.
UpTrendLen  is 10.

! ABBREVIATIONS:
C  is [close].
C1 is valresult(C,1).
C2 is valresult(C,2).
H  is [high].
L  is [low].
L1 is valresult(L,1).
O  is [open].
O1 is valresult(O,1).
OSD  is offSetToDate(month(),day(),year()).

!BULL / BEAR MARKET DETERMINATION:
SPXc is TickerUDF("SPX",C).
Bull if simpleavg(C,200) > simpleavg(C,200,10).
Bear if not Bull.

!FUNCTIONS AND RULES FOR THREE BLACK CROWS CANDLE PATTERN:
Range is H - L.
HHoffset is scanany(H = ∧highresult(H,HHLen),HHLen) then OSD.
AvgRng is simpleavg(Range,RangeLen,∧HHoffset).
LowerZoneC if C < L + (Range * 1/CandleZones).
Tall if Range > AvgRng.
BlackCrow1 if Tall
 and LowerZoneC
 and slope2(C,UpTrendLen) > 0
 and  H = highresult(H,HHLen).
BlackCrow2 if Tall
 and LowerZoneC
 and O <= O1
 and O >= C1.
ThreeBlackCrows if valrule(BlackCrow1,2)
 and countof(BlackCrow2,2)=2
 and countof(L < L1,2)=2.
Bull3BlackCrows if Bull and ThreeBlackCrows.
Bear3BlackCrows if Bear and ThreeBlackCrows.


