The AIQ code and EDS file based on Donald W. Pendergast’s article in the 2014 Bonus Issue of Stocks & Commodities, “A Trading Method For The Long Haul,” can be found at http://TradersEdgeSystems.com/traderstips.htm.
The code I provide there for the long haul system is modified somewhat from the author’s descriptions as follows. First, I did not implement the fundamental rule, but this can be done if a data source is located that can export the fundamental fields needed for each stock into a .csv file. This could then be imported into the fundamental module. Second, I modified the exit to add an RSI profit target and changed some of the exit parameters.
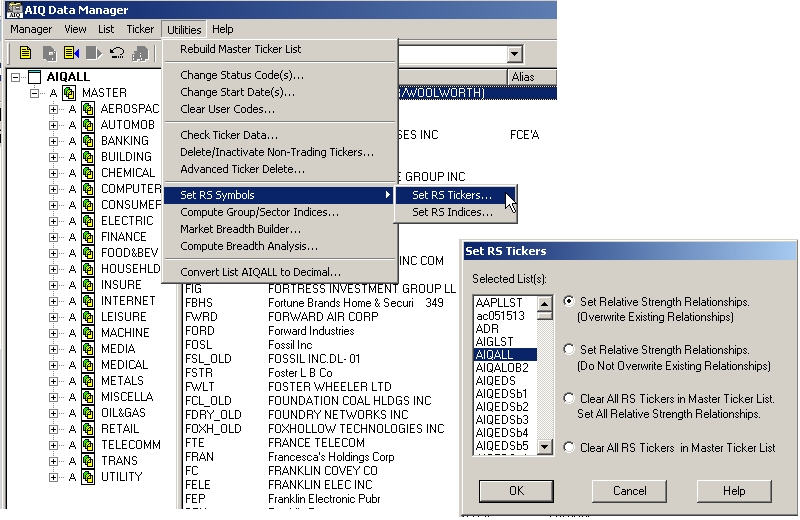
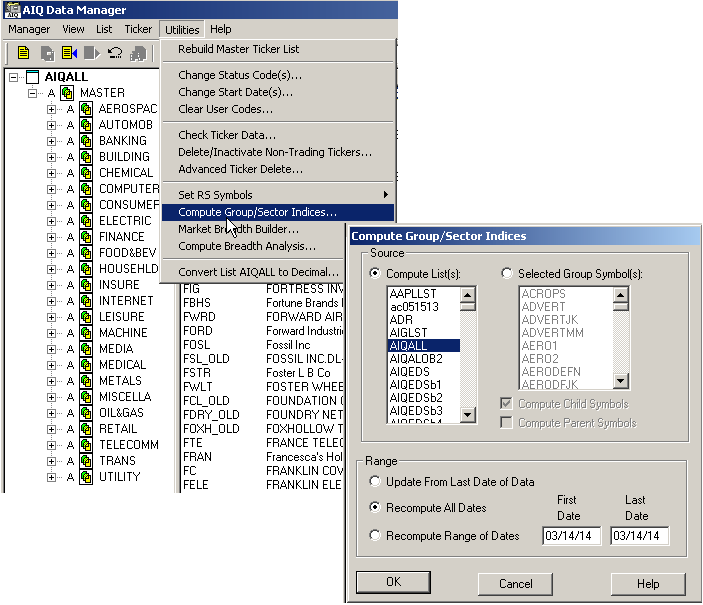
To get the code to run properly, the AIQALL list of stocks and groups must be installed and updated on the user’s computer. To do this, first get the most recent AIQALL list from the AIQ website, then add all the stocks from the latest data disk that have trading volume greater than about 200,000 shares. We need these in order to have enough stocks to compute the group indexes. Next, we would download data for all the stocks in the database up to the current date. Then, as shown in Figure 6, we would set the RS tickers to the AIQALL list, and also, as shown in Figure 7, recompute all dates for all the groups in the AIQALL list.

FIGURE 6: AIQ DATA MANAGER. Use the AIQ Data Manager to set the RS tickers to the AIQALL list.

FIGURE 7: AIQ DATA MANAGER. Use the AIQ Data Manager to compute the group & sector indexes for the AIQALL list.
The EDS file containing the code has the properties set to the AIQALL list. If you are building an EDS file directly from the code listing below, then be sure to set the properties to the AIQALL list.
!A Trading Method for the Long Haul
!Author: Donald W. Pendergast Jr., TASC Bonus Issue 2014
!Coded by: Richard Denning 3/10/14
!www.TradersEdgeSystems.com
!INPUTS:
trendLen is 200.
rsiLen is 2.
minAvgVolume is 10000.
volaLen is 21.
relStrLen is 80.
minVolaRatio is 0.5.
rsSPXmin is 1.0.
rsGroupmin is 1.0.
trailBars is 2.
rsiBuyLvl is 5.
rsiExitLvl is 95.
exitLen is 18.
C is [close].
H is [high].
L is [low].
PD is {position days}.
!LONG TERM MOVING AVERAGE:
emaLT is expavg(C,trendLen).
emaST is expavg(L,exitLen).
!RSI WILDER
!To convert Wilder Averaging to Exponential Averaging use this formula:
!ExponentialPeriods = 2 * WilderPeriod - 1.
U is C-valresult(C,1).
D is valresult(C,1)-C.
rsiLen1 is 2 * rsiLen - 1.
AvgU is ExpAvg(iff(U>0,U,0),rsiLen1).
AvgD is ExpAvg(iff(D>=0,D,0),rsiLen1).
rsi is 100-(100/(1+(AvgU/AvgD))).
!VOLATILITY
price1 is H.
price2 is L.
ratio is price1 / price2.
dp is Ln(ratio).
dpsqr is Ln(ratio) * Ln(ratio).
totdpsqr is sum(dpsqr,volaLen).
sumdp is sum(dp,volaLen).
sumdpsqr is sumdp * sumdp.
sumdpave is sumdpsqr / volaLen.
diff is totdpsqr - sumdpave.
!!use 252 for daily, or 52 for weekly below
factor is 252 / (volaLen-1).
result is sqrt(diff * factor).
vola  is result * 100 .
volaAvg is expavg(vola,volaLen).
volaSPXavg is tickerUDF("SPX",volaAvg).
volaRatio is volaSPXavg/volaAvg.
!AVERAGE VOLUME
avgVolume is expavg([volume],50).
!RELATIVE STRENGTH
roc is C / valresult(C,relStrLen).
rocSPX is tickerUDF("SPX",roc).
rocGroup is tickerUDF(rsticker(),roc).
groupSymbol is tickerUDF(rsticker(),symbol()).
groupName is tickerUDF(rsticker(),description()).
rsSPX is roc / rocSPX.
rsGroup is rocGroup / rocSPX.
!SCREENING RULES
VolumeRule if avgVolume > minAvgVolume.
TrendRule if C > emaLT.
VolaRule if volaRatio > minVolaRatio and simpleavg(H-L,10) > simpleavg(H-L,200).
RelStrRule if rsSPX > rsSPXmin and rsGroup > rsGroupmin.
PullbackRule if rsi < rsiBuyLvl.
EnoughData if hasdatafor(trendLen+10) > trendLen.
!FundamentalRule if [eps]>[eps est].
Screen if EnoughData
and TrendRule
and VolaRule
and RelStrRule
and PullbackRule
!and FundamentalRule
and VolumeRule.
EntryTrigger if C > lowresult(H,2,1).
Buy if valrule(Screen,1) and EntryTrigger.
Exit if (C < lowresult(L,trailBars,1))
or
(valrule(C > emaST,1) and C < emaST)
or
rsi > rsiExitLvl.
ShowValues if EnoughData.

