If you’ve been trading for any length of time, you’ve probably noticed something frustrating.
You understand what indicators are. You know what MACD stands for. You can draw Bollinger Bands on a chart.
But somehow, you’re still not getting the results you want.
Here’s why: There’s a massive difference between knowing about technical indicators and actually using them to make profitable trading decisions.
Most trading education focuses on one or the other. Either you get theoretical knowledge with no practical application, or you get specific strategies with no understanding of why they work.
Today, I want to show you why you need both – and how to get them.
The Foundation: Understanding Technical Indicators
Let’s start with a simple question: Do you really understand what MACD is measuring?
Not just the textbook definition. I mean, do you understand what the convergence and divergence of moving averages tells you about market momentum?
Most traders don’t.
They know MACD exists. They know there’s a signal line and a histogram. They might even know the standard 12, 26, 9 settings.
But they don’t understand what’s actually happening beneath the surface.
This is why foundation matters.
The 29 Essential Indicators Every Trader Should Know
Professional traders don’t just use one or two indicators. They have a complete toolkit they can draw from depending on market conditions.
Here are just some of the critical indicators you should master:
Trend Indicators:
- Moving Averages (Simple and Exponential)
- MACD (Moving Average Convergence Divergence)
- ADX (Average Directional Index)
- Parabolic SAR
Momentum Indicators:
- RSI (Relative Strength Index)
- Stochastics
- Commodity Channel Index
- Velocity
Volume Indicators:
- Volume bars
- Volume Oscillator
- Accumulation/Distribution
- Volume Accumulation Percentage
Volatility Indicators:
- Bollinger Bands
- Trading Bands
- Volatility Index
Pattern Recognition Tools:
- ZigZag
- 21-Day High/Low
- Advance/Decline Indicators
Each of these indicators serves a specific purpose. Each works best in specific market conditions. And most importantly, each becomes exponentially more powerful when combined with others.
Why Optimal Settings Matter
Here’s something most traders get wrong: They think indicator settings are arbitrary.
They’re not.
Gerald Appel didn’t choose 12, 26, and 9 for MACD randomly. These numbers correspond to trading weeks – 12 periods is roughly two and a half weeks, 26 is about one month, and 9 represents approximately two weeks.
This alignment with natural trading cycles is why these settings work so well across different markets and timeframes.
Understanding the “why” behind optimal settings helps you make better decisions about when to adjust them (and when not to).
The Execution: Mastering High-Probability Patterns
Now, let’s say you understand all the indicators. You know what they measure, when to use them, and how to optimize their settings.
You’re still missing something critical: Pattern recognition.
This is where most traders fail. They understand the tools but don’t know how to identify the highest-probability setups.
The Power of MACD Divergence
Let me give you a real example.
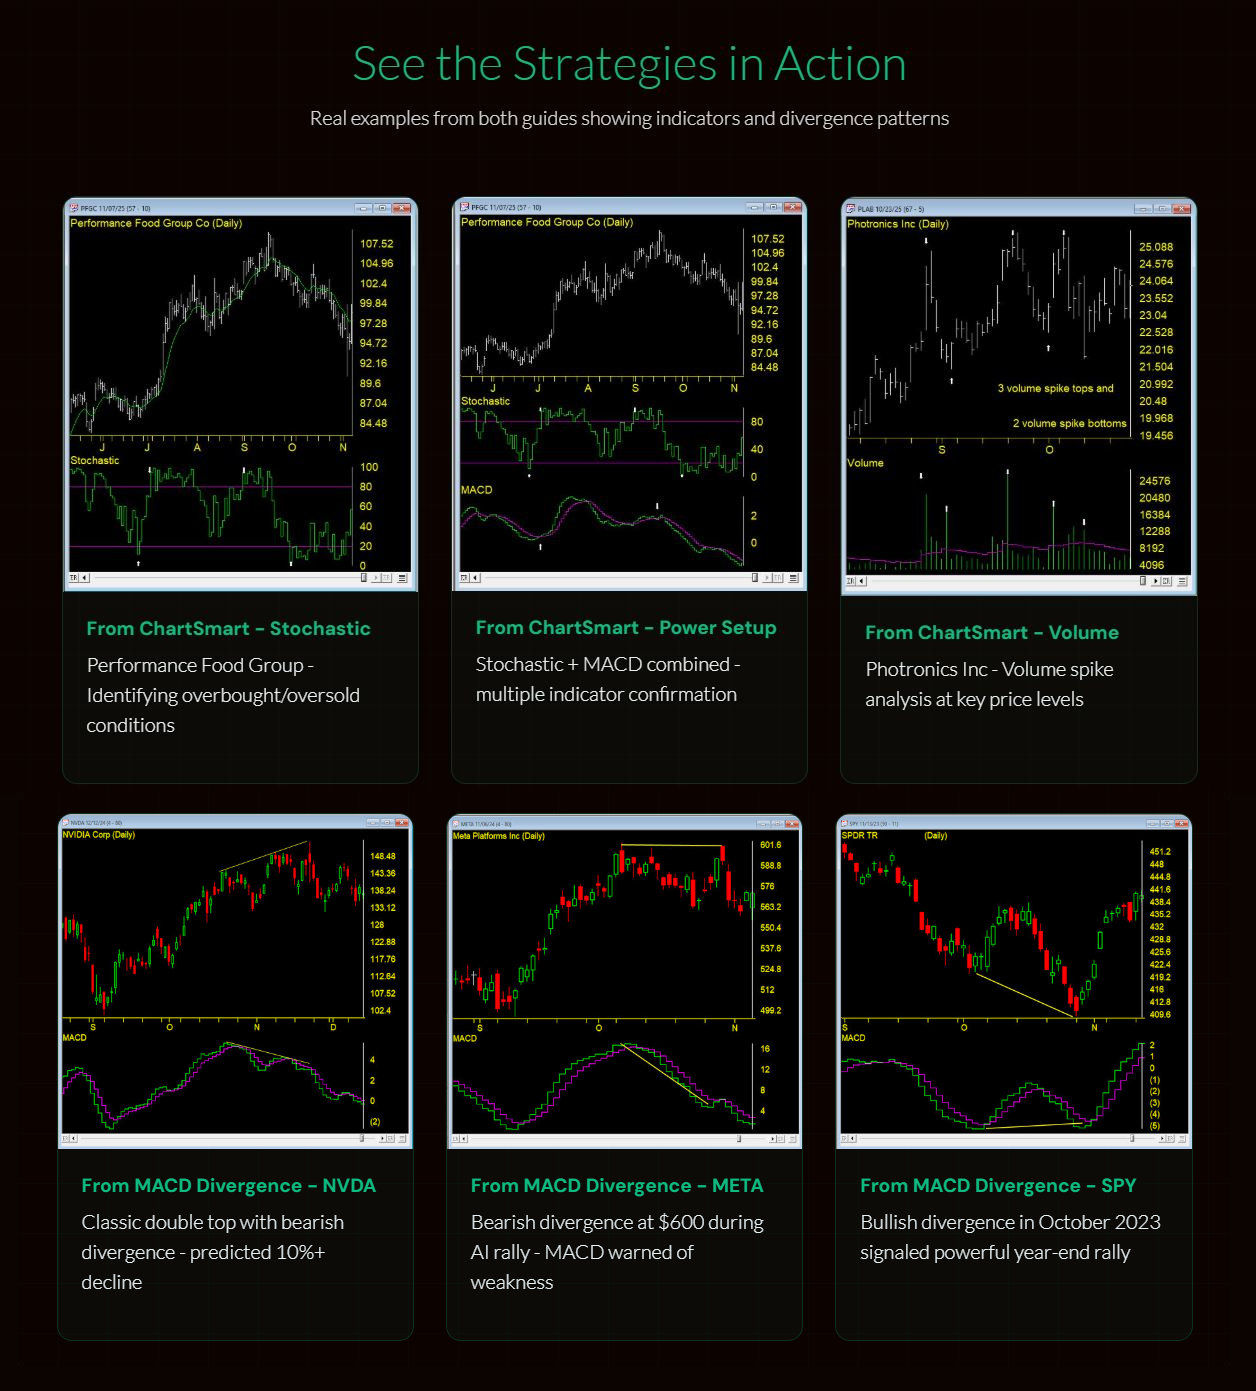
In November 2024, NVIDIA was trading around $140-150. Most traders were bullish. The momentum looked strong. The stock was making new highs.
But there was a problem.
While price was making higher highs, MACD was making lower highs. This is called bearish divergence – and it’s one of the most powerful reversal signals in technical analysis.
Traders who recognized this pattern could have anticipated the 10%+ pullback that followed.
This is the power of pattern recognition.
The Four Types of Divergence
There are actually four types of divergence patterns every trader should master:
1. Regular Bullish Divergence
- Price makes lower low, MACD makes higher low
- Signals potential reversal from downtrend to uptrend
- Best at significant support levels
2. Regular Bearish Divergence
- Price makes higher high, MACD makes lower high
- Signals potential reversal from uptrend to downtrend
- Best at resistance levels (like the NVIDIA example)
3. Hidden Bullish Divergence
- Price makes higher low, MACD makes lower low
- Signals trend continuation in uptrends
- Great for adding to positions during pullbacks
4. Hidden Bearish Divergence
- Price makes lower high, MACD makes higher high
- Signals trend continuation in downtrends
- Used for entering short positions during bounces
Real Examples from Major Stocks
Let me show you some recent examples:
Meta Platforms (META) – October 2024
During the AI-driven rally, META pushed to $600. Most traders were chasing the momentum. But MACD showed clear bearish divergence, warning that the rally was losing steam. The subsequent correction proved the pattern right.
S&P 500 (SPY) – October 2023
The market made a lower low in late October 2023, causing fear among traders. But MACD showed bullish divergence, suggesting selling pressure was exhausted. This pattern preceded the powerful year-end rally.
Apple (AAPL) – April 2023
During an uptrend, AAPL pulled back, making a higher low. MACD made a lower low – hidden bullish divergence. This continuation pattern signaled that the uptrend was intact, providing an excellent entry point.
These aren’t cherry-picked examples. These are patterns that appeared on major stocks, providing actionable trading opportunities for those who knew how to recognize them.
Why You Need Both Foundation and Execution
Here’s the key insight: Foundation without execution is just theory. Execution without foundation is just guessing.
You need both.
The Foundation (Indicator Knowledge) Gives You:
- Understanding of what’s happening in the market
- Knowledge of which tools to use when
- Ability to optimize settings for your timeframe
- Framework for combining indicators
- Confidence in your analysis
The Execution (Pattern Recognition) Gives You:
- Specific entry and exit signals
- High-probability setup identification
- Risk management framework
- Real-world application
- Actionable trading strategies
Together, they create complete technical analysis mastery.
How to Get Started
If you’re serious about improving your trading, you need both pieces of the puzzle.
That’s why I’ve created the Technical Analysis Mastery Bundle – combining two comprehensive guides that give you both the foundation and the execution:
ChartSmart: The Complete Technical Indicators Guide
- All 29 essential indicators explained in plain English
- Optimal settings and parameters for each
- 40+ real chart examples from major stocks
- 6 proven indicator combinations
- Strategies like the Stochastic + MACD power setup
- Volume confirmation techniques
- Bollinger Band squeeze patterns
MACD Divergence: High-Probability Reversal Patterns
- All 4 types of divergence explained
- Real examples from NVDA, META, SPY, AAPL, MSFT, AMZN
- Double top and double bottom pattern trading
- Complete entry, stop loss, and profit target framework
- Risk and money management systems
- Platform-ready setup instructions
The Investment
Individually, these guides cost $59 and $59 respectively – $118 total.
But when you get them together as a bundle, you pay just $88.
That’s $30 in savings, and more importantly, you get the complete toolkit you need to master technical analysis from foundation to execution.
What You Get Immediately
When you order the Technical Analysis Mastery Bundle, here’s what happens:
- Instant access to both comprehensive PDF guides
- 100+ pages of actionable trading knowledge
- 40+ real chart examples showing exactly how patterns work
- Platform setup instructions so you can implement immediately
- Lifetime access with no recurring fees
This isn’t a course that drips content over weeks. You get everything immediately and can start learning today.
Real Results You Can Expect
Let me be clear about something: These guides won’t make you rich overnight. No trading education can promise that.
But here’s what they will do:
Short-term (First Month):
- Better understanding of what indicators actually measure
- Ability to identify divergence patterns on your own charts
- More confidence in your analysis
- Fewer conflicting signals causing confusion
Medium-term (3-6 Months):
- Consistently identifying high-probability setups
- Better entry and exit timing
- Improved risk management
- Growing pattern recognition skills
Long-term (6+ Months):
- Complete technical analysis mastery
- Professional-level chart reading
- Ability to combine multiple indicators effectively
- Track record of well-timed entries and exits
The guides give you the knowledge and frameworks. Your practice and application turn that into trading results.
Who This Bundle Is For
This bundle is perfect if you:
- Want to build a solid foundation in technical analysis
- Are tired of conflicting signals and confusing indicators
- Want to identify high-probability setups like professionals do
- Need practical strategies you can implement immediately
- Trade stocks, ETFs, forex, crypto, or other markets
- Are committed to improving your trading skills
This bundle is NOT for:
- People looking for “get rich quick” schemes
- Traders who want someone else to give them signals
- Those unwilling to invest time in learning
- Anyone expecting guaranteed profits from education alone
The Bottom Line
Technical analysis mastery requires two things: solid foundation and practical execution.
Most traders only get one or the other. That’s why most traders struggle.
This bundle gives you both.
The complete indicator toolkit. The pattern recognition skills. The trading frameworks. The real examples. Everything you need to analyze charts like a professional.
Usually $118 if purchased separately. Just $88 as a bundle.
One payment. Lifetime access. Complete mastery.
Frequently Asked Questions
Q: Do I need prior trading experience?
A: Basic trading knowledge is helpful, but the guides explain everything in plain English. If you know what a stock chart is and have traded before, you’re ready for this content.
Q: What markets do these strategies work in?
A: Technical analysis works across all liquid markets – stocks, ETFs, forex, crypto, commodities. The principles are universal.
Q: Can I get a refund if I don’t like it?
A: Due to the digital nature of the products, all sales are final. However, the guides include 100+ pages of content with 40+ real examples, so you can see exactly what you’re getting before you buy.
Q: How long do I have access?
A: Lifetime. One payment, permanent access. No recurring fees or subscriptions.
Q: Will this work on my trading platform?
A: Yes. The guides include general instructions that work across most major platforms (TradingView, ThinkOrSwim, MetaTrader, AIQ, etc.). The indicators covered are standard across all platforms.
Q: How long will it take to master this material?
A: You can read through both guides in a few days. But real mastery comes from applying the concepts to live charts over weeks and months. Most traders see significant improvement within 1-3 months of consistent practice.
Q: Is this a course with videos?
A: No, these are comprehensive PDF guides with extensive chart examples. You read through the material at your own pace and apply the concepts to your own trading.
Your Next Step
The gap between knowing about indicators and using them profitably is what separates struggling traders from successful ones.
This bundle bridges that gap.
The foundation. The execution. The complete toolkit.
For less than the cost of a single bad trade, you get everything you need to master technical analysis from theory to practice.
Get Started with the Bundle Here →https://aiqeducation.com/macd-divergence-book-chartsmart/
$88. Two comprehensive guides. Complete technical analysis mastery.
The question isn’t whether you should invest in your trading education.
The question is: How much is it costing you not to?