Let’s face it, the human eye is naturally drawn to the “shiny object.” Hence the reason all the focus is on the Nasdaq Index (by the way, I think there was a glitch with my price quote software yesterday, because at one point it showed that the Nasdaq 100 Index was negative for the day. I contacted my quote service and pointed out this obvious error and apparently they fixed it because the Nasdaq – as it is supposed to be – was again showing a gain by the end of the day – while all the other indexes were down. But I digress.)
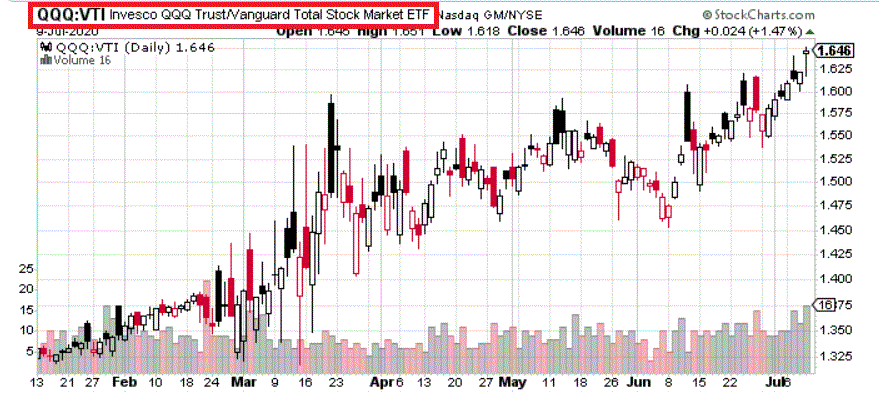
The bottom line is that the type of large-cap/technology related/growth stocks that are presently dominating the Nasdaq 100 Index are (or at least “have”) been the place to be since the market bottomed in March. Figure 1 displays the performance of ticker QQQ (an ETF that tracks the Nasdaq 100) relative to the performance of the Vanguard Total Stock Market ETF.
Figure 1 – Ticker QQQ versus ticker VTI (Courtesy StockCharts.com)
The message is pretty obvious, right? Pile into Apple, Microsoft and Amazon (which account for roughly 34% of the value of the index at the moment) and forget everything else!!!
Oh sure, if you want to toss in a little Facebook, Google, Tesla and NVIDIA just for “diversification”, that’s OK too. But avoid “everything else”!
And it’s a great strategy…. Well, as least as long as it lasts.
The “Stuff” Index
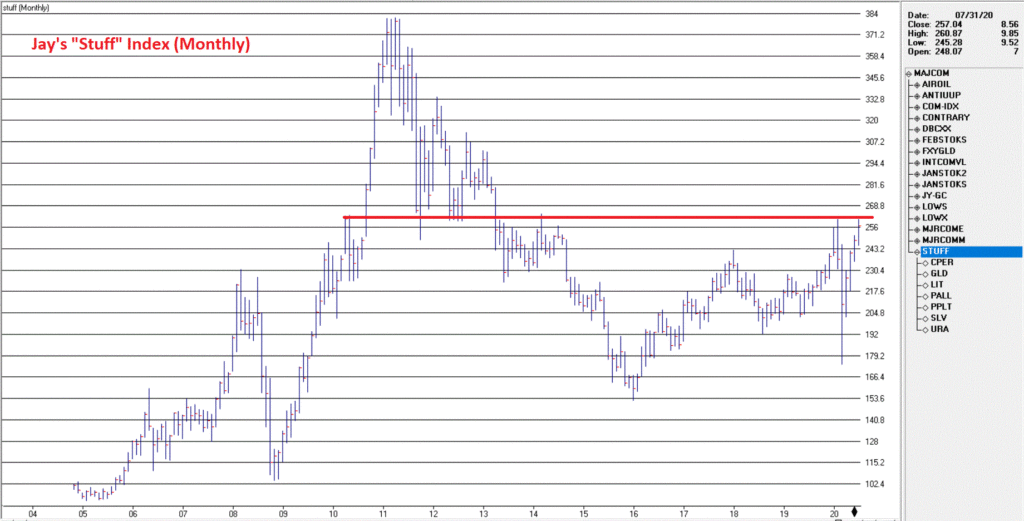
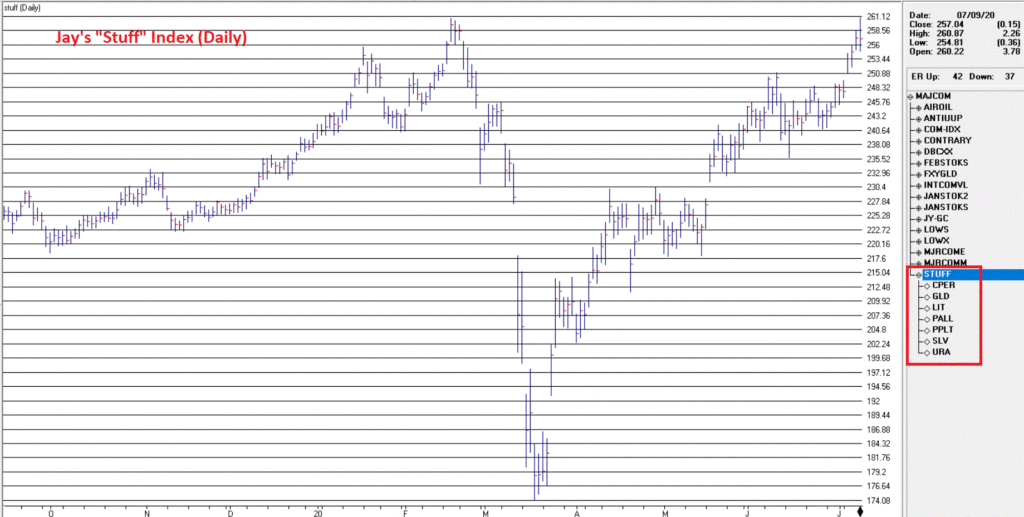
Anyway, I created my own index dubbed “Stuff” – it would probably be more accurate to call it the “metals and material” index, but I prefer “Stuff” (sorry, it’s just my nature). Figure 2 displays a monthly chart; Figure 3 displays a daily chart.
This index bottomed on 3/18, since then it has climbed +44% (for the record, like everything else it has lagged the Nasdaq 100 which is up +50% over the same time, but it has outperformed all other relevant major stock market indexes).
The index is comprised of the following ETFs:
CPER (copper)
GLD (gold)
LIT (lithium)
PALL (palladium)
PPLT (platinum)
SLV (silver)
URA (uranium)
The top performer among this group since the 3/18 low is LIT which is up +84%.
OK, so this “Stuff” index has still underperformed the Nasdaq Index, so what’s the point?
The Point
Except for gold – which has rallied to a seven year high – no one it seems has the slightest idea that there is “life beyond” large-cap/tech/growth monolith presently sucking up all the sunshine.
Where do things go from here? Will Nasdaq keep running? Or is this rally overdone? And what about “Stuff”? Is there any guarantee that it’s strong run will continue? I don’t claim to have the answers.
As you can see in Figures 2 and 3, the Stuff Index is presently bumping up against resistance (while the Nasdaq has broken out to the upside and running to new highs).
So here is an interesting rhetorical question to ponder;
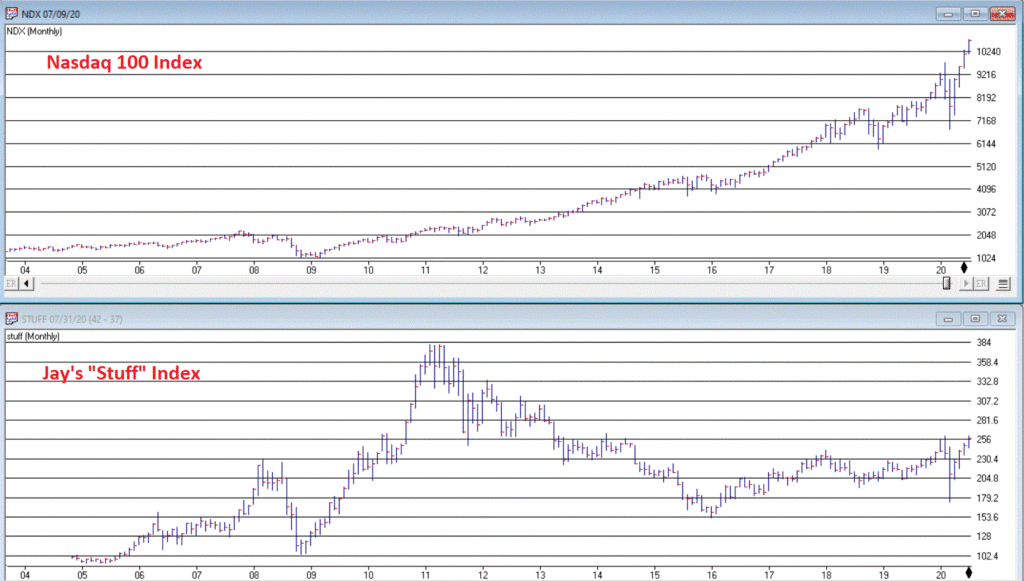
First look at Figure 4 which displays the monthly Nasdaq 100 on the top and my Stuff Index on the bottom.
Figure 4 – Nasdaq 100 Index vs. Stuff Index (Courtesy AIQ TradingExpert)
The question to ponder: Which has more upside potential going forward?
See also Jay Kaeppel Interview in July 2020 issue of Technical Analysis of Stocks and Commodities magazine
Disclaimer: The information, opinions and ideas expressed herein are for informational and educational purposes only and are based on research conducted and presented solely by the author. The information presented represents the views of the author only and does not constitute a complete description of any investment service. In addition, nothing presented herein should be construed as investment advice, as an advertisement or offering of investment advisory services, or as an offer to sell or a solicitation to buy any security. The data presented herein were obtained from various third-party sources. While the data is believed to be reliable, no representation is made as to, and no responsibility, warranty or liability is accepted for the accuracy or completeness of such information. International investments are subject to additional risks such as currency fluctuations, political instability and the potential for illiquid markets. Past performance is no guarantee of future results. There is risk of loss in all trading. Back tested performance does not represent actual performance and should not be interpreted as an indication of such performance. Also, back tested performance results have certain inherent limitations and differs from actual performance because it is achieved with the benefit of hindsight.
Market volatility continues. In this update we’ll take a look at the current AI signals on the Dow Jones. For folks less familiar with our AI engine here’s a recap of what we do.
TradingExpert Pro uses two AI knowledge bases, one specifically designed to issue market timing signals and the other designed to issue stock timing signals.
Each contains approximately 400 rules, but only a few “fire” on any given day. In the language of expert systems, those rules that are found to be valid on a particular day are described as having “fired”.
Rules can fire in opposite directions. When this happens, the bullish and bearish rules fight it out. It’s only when bullish rules dominate that the Expert Rating signal is bullish, or when bearish rules dominate that the Expert Rating signal is bearish.
The Expert Rating consists of two values.
The upside rating is the value on the left and the downside rating is on the right. Expert Ratings are based on a scale of 0 to 100. An Expert Rating of 95 to 100 is considered a strong signal that the Stock or market may change direction.
An Expert Rating below 90 is considered meaningless. A low rating means that there is not enough consistency in the rules that fired to translate to a signal. The expert system has not found enough evidence to warrant a change from the last strong signal.
The importable AIQ EDS file based on Markos Katsanos’ article in the March 2020 issue of Stocks & Commodities, “Using Relative Strength To Outperform The Market,” can be obtained on request via email to info@TradersEdgeSystems.com. The code is also available below.
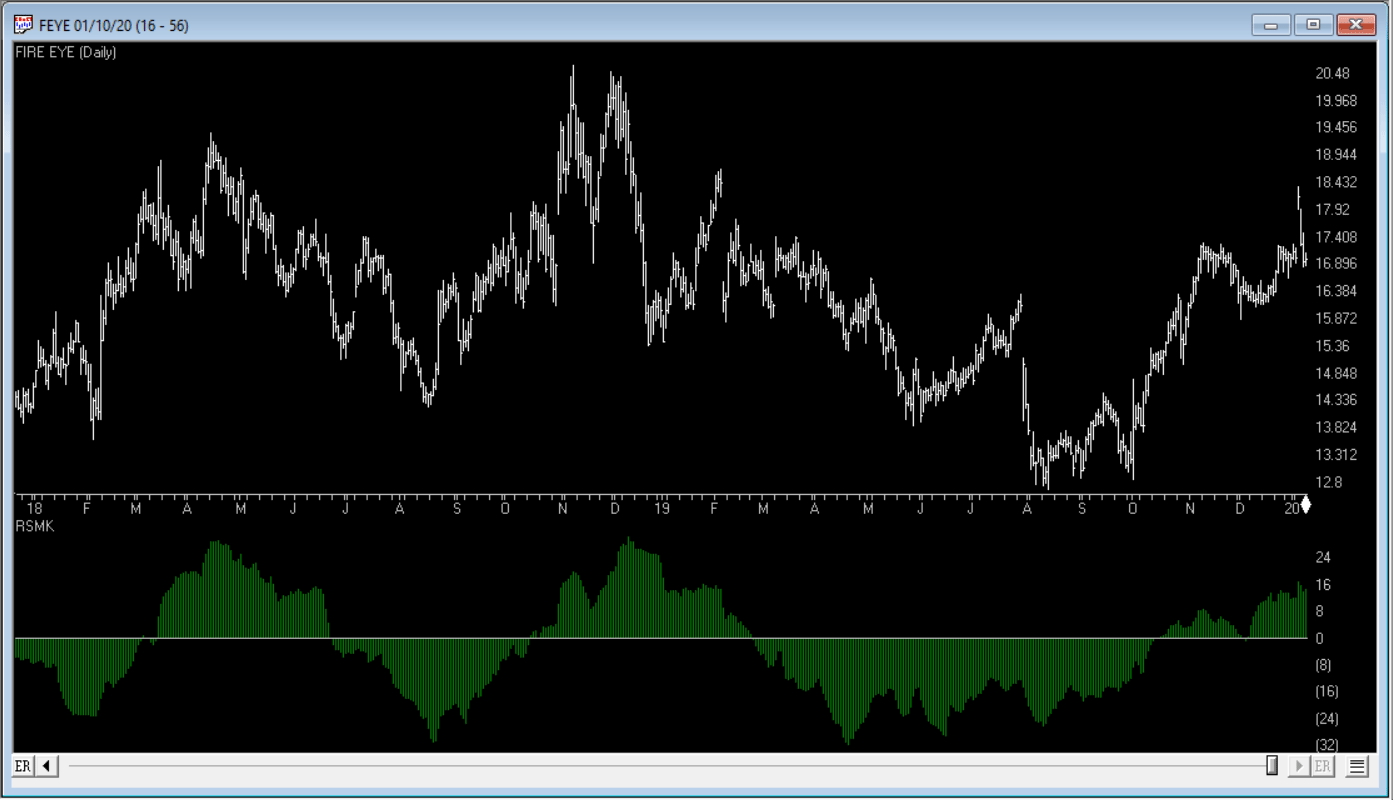
I coded the indicator described by Katsanos in his article. Figure 5 shows the RSMK indicator with a 90-bar length on a chart of Fire Eye (FEYE). The trading system is also coded.
!USING RELATIVE STRENGTH TO OUTPERFORM THE MARKET !Author: Markos Katsanos, TASC March 2020 !coded by: Richard Denning, 01/13/2020 !www.TradersEdgeSystems.com !RSMK (Relative Strength) Indicator !Copyright Markos Katsanos 2020
C is [close].
RSBARS is 90.
SK is 3.
SEC2 is tickerudf("SPY",C).

!RSMK:
RSMK is expavg(ln(C/(SEC2))-ln(valresult(C/(SEC2),RSBARS)),3)*100.

!RSMK System:
Buy if RSMK > 0 and valrule(RSMK<0,1) and hasdatafor(200) >= 150.
Sell if {position days} >= 9*21.
FIGURE 5: AIQ. The RSMK indicator is shown on a chart of FEYE during 2018 and 2019.
I hope all of you are keeping healthy and staying safe during this COVID-19 pandemic. Over the last month, we have seen a significant drop in new cases of COVID-19 in most states, but now that most establishments of business have opened, there is some speculation that we may see a rise in COVID-19 cases again.
RECAP:
Over the last month, as COVID-19 cases have dropped, the stock and bond markets have risen dramatically. As of last Friday, however, most of the indexes are still slightly to moderately down. The technology-laden companies in the NASDAQ are the beneficiaries of this “stay at home” policy with returns up 10% this year.
The value sector, which contains the small to midcap companies, banks, energy companies, the retail sector, the airlines, telecommunications, restaurants, and more, are still down by 6-23% for 2020, but are rising dramatically as speculators try to get in now to buy cheap shares. The growth sector has done relatively well, but only a few large companies have contributed.
CURRENT TRENDS:
I continue to like the large tech and health care companies, however, the very large-cap NASDAQ stocks like Apple and Google should start to slow. If the market DOESN’T have a correction in the fall, then we should see the markets continue to recover, then the midcap to small-cap stocks may show a continuation of its upward trend. I am recommending clients move the large-cap growth profits towards the midcap sector somewhat. The Midcaps are down 6.7-11.76% depending on if its growth or value, and particular issues have more of a potential to move upward, in my opinion. A year or two out from this point, I think this sector and the markets should continue the trend nicely higher.
Can it go down from here into the fall and winter if we have a second wave down? Absolutely, but it is an excellent time to add money to your equity side in a diversified portfolio over the next 6 -12 months I like the corporate bond sector better than the government sector going forward. Many people are doubling up their contributions monthly. If you are more than five years before retirement, you may want to think about doing something similar. If stocks are cheap, then isn’t it smart to buy when they are reasonably priced if, over the long term, the market should be higher? But over the short term. I think the markets have risen too fast and over the short-term, I can see up to another 5% more but not much after that. If you are in or nearing retirement, this may be an excellent time to take a little money out of the stock market over the next few weeks.
Some of the INDEXES of the markets both equities and interest rates are below. The source is Morningstar.com up until June 8, 2020. These are passive indexes.
Dow Jones -4.0% S&P 500 -.50% EQUAL WEIGHTED S&P 500 -4.0% NASDAQ Aggressive growth +10% Large Cap Value -12.5% I Shares Russell 2000 ETF (IWM) Small cap -9.0% Midcap stock funds -6.7-11.76% International Index (MSCI – EAFE ex USA -8.2% Financial stocks -14% Energy stocks -23.53% Healthcare Stocks +1.8%
Moderate Mutual Fund Investment Grade Bonds (AAA) Long duration -2.5% High Yield Merrill Lynch High Yield Index -3.8%
Floating Rate Bond Funds -4.4% Short Term Bond +1.1% Fixed Bond Yields (10 year) .95% Yield
Classicalprinicples.com and Robert Genetskis Excerpts:
Stocks continued to move higher this past week. The major indexes added 2%-3%, while small-cap ETFs led with gains of 4%-6%. The S&P 500 is now within 3% of my estimate of its value. A replay of the failed Occupy Wall Street lawlessness will drive more support for law and order. Rather than hurt Trump, it should help to reelect him. There is also some good news on the virus. Despite the reopening of the economy, active cases have begun declining. Up to now, my expectation that stocks would begin consolidating has not materialized. The stock market assumes my forecast for a rapid recovery will occur without any setbacks. Hope so. Nonetheless, with both cautious state Governors and fed policy paying people not to work, a temporary setback can always arise. Although the market is fully-valued, the outlook for stocks remains mostly bullish.
A Look-Back
Private employment increased by 3 million in May, close to my estimate of 4 million. The rebound was well above the widely predicted loss of 81⁄2 million jobs. Private payrolls remain 18 million less than at their peak in February. Earlier in the week, the ISM business surveys show the economy grew modestly going into early May. The improvement appears to have brought the economy from 80% of its peak performance to 85%. Auto sales went from 50% of normal levels in April to 70% in May. New orders for manufacturing and service companies also improved in May. Orders in May were 30% below their peak compared to 40% below in April. My forecast for job gains in May was based on Weekly insured unemployment claims which were 50% less than the number in April.
Dr. Genetski’s opinion is that every person and circumstance is different. Please call me to address your holistic goals to strategize. There are no guarantees expressed or implied in any part of this correspondence.
Dow Jones
As you can see the Dow Jones is now only down 4% for 2020. I do not see more than a 5% upward move before it is fully valued. There are three resistance points to the left, the first level of resistance is 27424 area, the second is 28404 area, and the third level is the 29000 area. You may be shocked that the market has gone this high. Remember, the stock and bond markets NEVER accommodates the majority of thinking. So when everyone that the markets are going lower it doesn’t, and when everyone it will continue higher it tops out.
The Momentum indicator signal of a BUY is when the pink line crosses above the blue line and a Sell signal is when it crosses on the downside. Currently it still is on the buy side. But it is getting long in the tooth and overbought.
The indicator to the lower left is call the SD-SK Stochastics indicator. When both of the lines go over 88 the market is very overbought and could be setting up for a fall. It is almost very overbought, but not yet.
Summary: I am still long term bullish, but only see the rally to continue for a short period more before I see a flattening or decline of the markets.
NASDAQ QQQ
The true Champ this year again has been the NASDAQ. These stocks include, Facebook, Amazon, Docusign, Paypal, Mcrosoft, Netflix, etc. All of the stocks that benefit by you and your businesses being home. The NASDAQ is now up 10% for the year while everything else in the normal world is down 6-33%. The NASDAQ is now getting a little OVERBOUGHT so I would not go out and buy a bunch of ultra large tech stocks here. In fact, the NASDAQ is right at its high for the year and if I had a lot of my money in the ultra large NASDAQ stocks I would probably redeploy some towards the midcap stocks with go balance sheets and prospects for a bright future. I will also get VERY CAUTIOUS if the NASDAQ closes below the lower trend line currently at the 9505 level. This trend line rises daily so please call me for a strategy session.
The MACD or momentum indicator is still positive, so as long as the trend is up, I am somewhat positive , but it is now getting over bought. Retirees may want to reduce a little at this point.
The SK-SD Stochastics is overbought just like it was in the Dow Jones. On Balance Volume is showing great conviction. That is a Bullish signal as it has broken to a new high
Support levels on the S&P 500 area are 3140, 3070, 2944, and 2796. These might be accumulation levels, especially2649, or 2500. 2936 and 3015 is resistance.
Support levels on the NASDAQ are 9675, 9513, and 9326 Topping areas 9845 and 10000 On t
The Dow Jones support is at 25245, 24,900, and 23951. Topping areas 27377 and 28419, 29020 and 29561.
These may be safer areas to get into the equity markets on support levels slowly on the accumulation areas.
THE BOTTOM LINE:
The market has rebounded nicely over the last month, mainly on the decline in Covid19 cases, and the economy is reopening. The NASDAQ has done the best and should continue to do well IF the market continues higher, the Midcap and Small caps, both growth and value side would probably outperform if the rally continues from here. My thinking is that the market continues to rally a little more, but as the Euphoria continues, I feel the market may stall a little above where we are now. If there is a significant rise in the number of new cases of COVID-19 before any successful treatment or vaccine, then the market would probably selloff, not to new lows but down to a support level listed above. There are trend-lines right below the markets, and if they are broken and close below those areas, then the markets could start a correction again. Trend-lines are essential to hold. If they don’t hold, then there could be a setback to support the levels stated above. I still like the USA market better than the international one.
Best to all of you,
Joe Bartosiewicz, CFP® Investment Advisor Representative 92 High Street Thomaston, CT 06787
860-940-7020
Charts provided by AIQ Systems:
Technical Analysis is based on a study of historical price movements and past trend patterns. There is no assurance that these market changes or trends can or will be duplicated shortly. It logically follows that historical precedent does not guarantee future results. Conclusions expressed in the Technical Analysis section are personal opinions: and may not be construed as recommendations to buy or sell anything.
Disclaimer:
The views expressed are not necessarily the view of Sage Point Financial, Inc. and should not be interpreted directly or indirectly as an offer to buy or sell any securities mentioned herein. Securities and Advisory services offered through Sage Point Financial Inc., Member FINRA/SIPC, an SEC-registered investment advisor.
Past performance cannot guarantee future results. Investing involves risk, including the potential loss of principal. No investment strategy can guarantee a profit or protect against loss in periods of declining values. Please note that individual situations can vary. Therefore, the information presented in this letter should only be relied upon when coordinated with individual professional advice.
*There is no guarantee that a diversified portfolio will outperform a non-diversified portfolio in any given market environment. No investment strategy, such as asset allocation, can guarantee a profit or protect against loss in periods of declining values.
It is our goal to help investors by identifying changing market conditions. However, investors should be aware that no investment advisor can accurately predict all of the changes that may occur in the market.
The price of commodities is subject to substantial price fluctuations of short periods and may be affected by unpredictable international monetary and political policies. The market for commodities is widely unregulated, and concentrated investing may lead to Sector investing may involve a greater degree of risk than investments with broader diversification.
There are a lot of things that don’t make sense these days. In fact, where would one even begin? So let’s move past all of that and look at something else that doesn’t seem to make sense one the face of it – i.e., the “Odd Couple” relationship between biotech and gold stocks.
The BIOGOLD Index
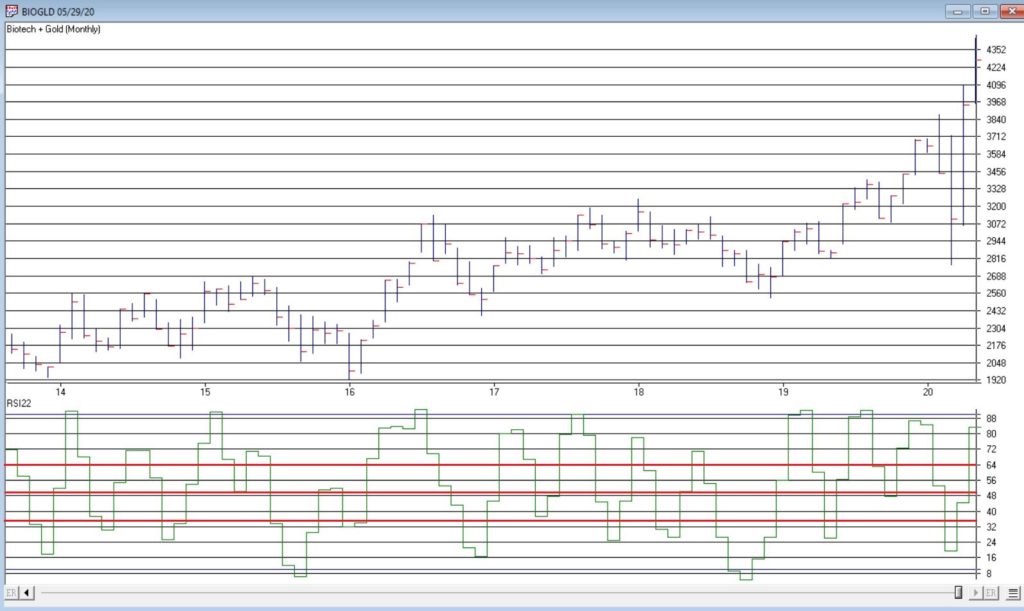
Using AIQ TradingExpert software I created my own “index” called “BIOGOLD” that simply combines ticker FBIOX (Fidelity Select Biotech) and ticker FSAGX (Fidelity Select Gold). The index appears in Figure 1.
Editors note: Creating your own index is a function of creating a group list in AIQ Data Manager. Information on creating lists and groups can be found in this PDF on p 11 of 14.
Also included in the lower clip is an indicator referred to as RSI32, which is the 2-day average of the standard 3-day RSI. The levels of 65, 50 and 35 are highlighted in red for reasons detailed below.
The Rules
For the record, I have changed “the rules” a few times over the years. Call it curve-fitting if you’d like, but the goal is to generate the timeliest signals. The rules now are as follows:
A “buy signal” occurs when either:
*The RSI32 drops to 35 or below
*The RSI32 drops below 50 (but not as low as 35) and then reverses to the upside for one month
After either of the buy signals above occurs, buy BOTH FBIOX and FSAGX
*After a buy signal, sell both funds when RSI32 rises to 64 or higher
To test results, we will:
*Assume that after a buy signal both FBIOX and FSAGX are bought in equal amounts
*We will assume that both funds are held until RSI32 reaches 64 or higher (i.e., there is no stop-loss provision in this test)
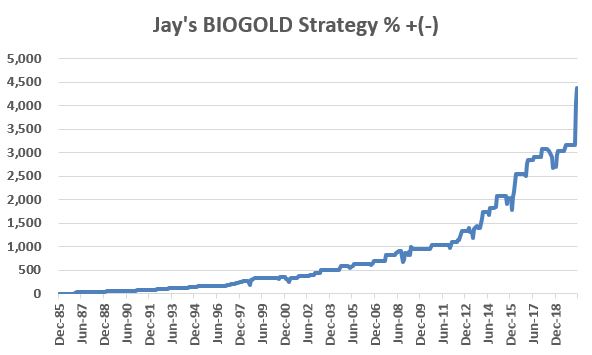
For testing purposes, we will not assume any interest earned while out of the market, in order to highlight only the performance during active buy signals. Figure 2 displays the hypothetical growth of $1,000 (using monthly total return data) using the “system”.
NOTE: All results are generated using total monthly return data for FBIOX and FSAGX, except for May 2020 which is based on price action only (my source of total return data does not update until sometime in June).
Figure 2 – Cumulative hypothetical % growth using Jay’s BIOGOLD System (1986-present)
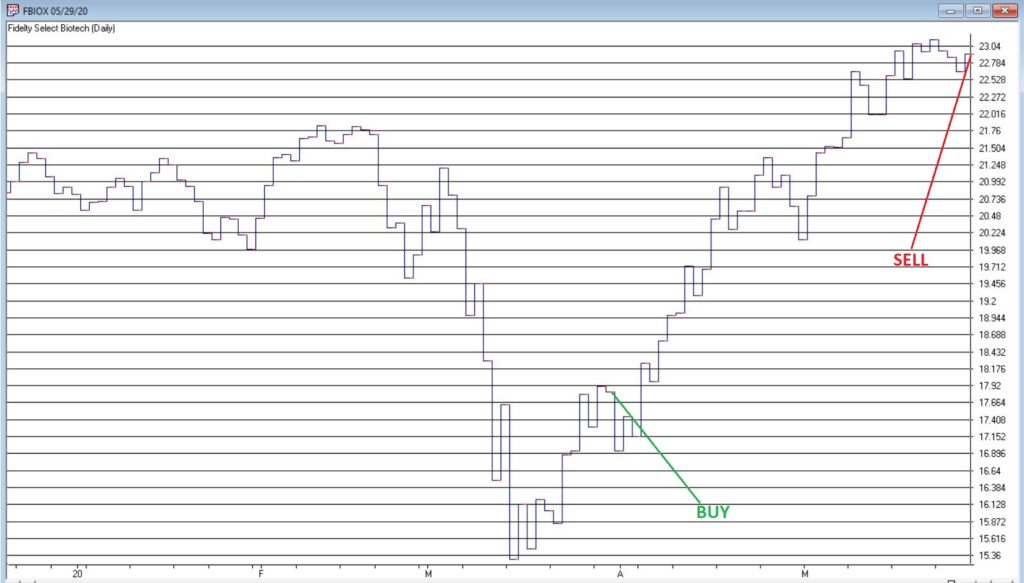
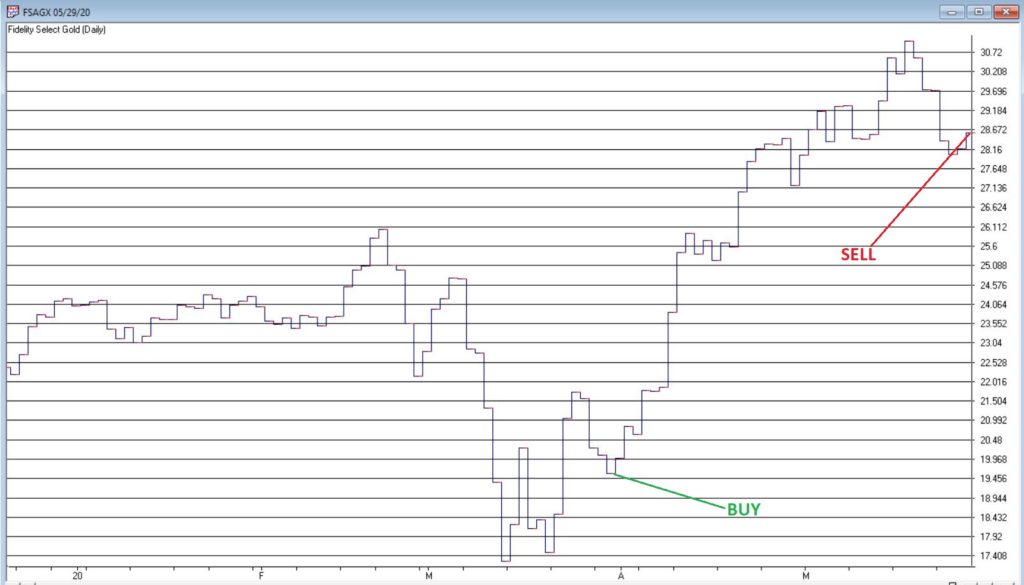
*The most recent BUY signal occurred at the end of March 2020 when the RSI32 indicator for BIOGOLD closed at 33.67.
*The most recent SELL signal occurred at the end of May 2020 when the RSI32 indicator for BIOGOLD closed at 76.96.
Figures 3 and 4 display the price action for FBIOX and FSAGX during this two-month period.
Is this really a viable approach to investing? That’s not for me to say. But it seems to do a pretty good job of identifying favorable times to be in with that “Odd Couple” of biotech and gold. So there’s that…
Disclaimer: The information, opinions and ideas expressed herein are for informational and educational purposes only and are based on research conducted and presented solely by the author. The information presented represents the views of the author only and does not constitute a complete description of any investment service. In addition, nothing presented herein should be construed as investment advice, as an advertisement or offering of investment advisory services, or as an offer to sell or a solicitation to buy any security. The data presented herein were obtained from various third-party sources. While the data is believed to be reliable, no representation is made as to, and no responsibility, warranty or liability is accepted for the accuracy or completeness of such information. International investments are subject to additional risks such as currency fluctuations, political instability and the potential for illiquid markets. Past performance is no guarantee of future results. There is risk of loss in all trading. Back tested performance does not represent actual performance and should not be interpreted as an indication of such performance. Also, back tested performance results have certain inherent limitations and differs from actual performance because it is achieved with the benefit of hindsight.