Category Archives: jay kaeppel

A Useful Interest Rate Indicator

2018 witnessed something of a “fake out” in the bond market.  After bottoming out in mid-2016 interest rates finally started to “breakout” to new multi-year highs in mid to late 2018. Then just as suddenly, rates dropped back down.
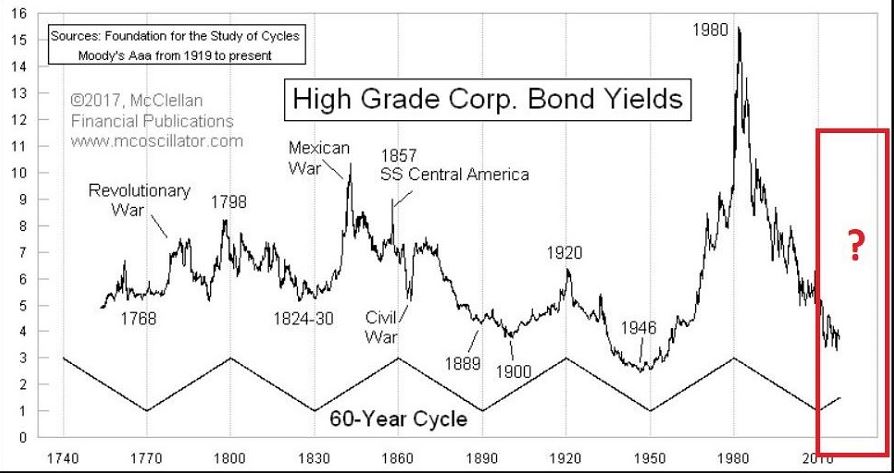
1

Figure 1 displays the tendency of interest rates to move in 60-year waves – 30 years up, 30 years down.  The history in this chart suggests that the next major move in interest rates should be higher.Figure 1 – 60-year wave in interest rates (Courtesy: www.mcoscillator.com)

A Way to Track the Long-Term Trend in Rates

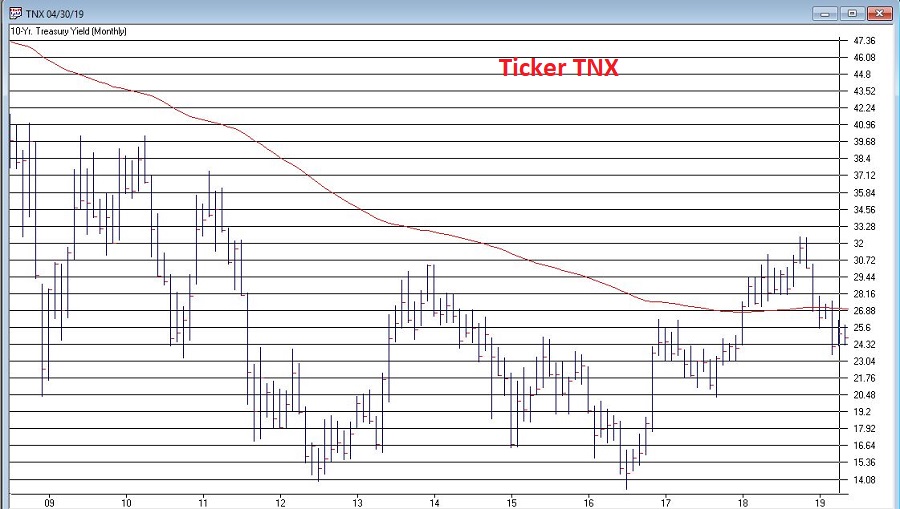
Ticker TNX is an index that tracks the yield on 10-year treasury notes (x10).  Figure 2 displays this index with a 120-month exponential moving average overlaid.  Think of it essentially as a smoothed 10-year average.
2

Figure 2 – Ticker TNX with 120-month EMA (Courtesy AIQ TradingExpert)

Interpretation is pretty darn simple.  If the month-end value for TNX is:

*Above the 120mo EMA then the trend in rates is UP (i.e., bearish for bonds)

*Below the 120mo EMA then the trend in rates is DOWN (i.e., bullish for bonds)
3

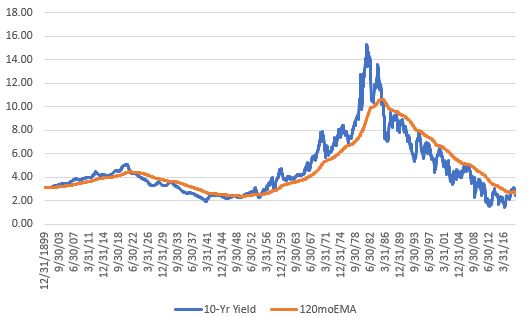
Figure 3 displays 10-year yields since 1900 with the 120mo EMA overlaid.  As you can see, rates tend to move in long-term waves.

Figure 3 – 10-year yield since 1900 with 120-month exponential moving average

Two key things to note:

*This simple measure does a good job of identifying the major trend in interest rates

*It will NEVER pick the top or bottom in rates AND it WILL get whipsawed from time to time (ala 2018).

*Rates were in a continuous uptrend from 1950 to mid-1985 and were in a downtrend form 1985 until the 2018 whipsaw.

*As you can see in Figure 2, it would not take much of a rise in rates to flip the indicator back to an “uptrend”.

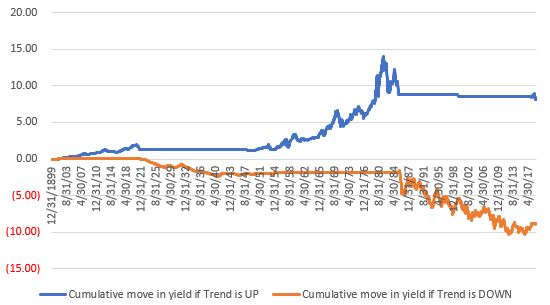
With those thoughts in mind, Figure 4 displays the cumulative up or down movement in 10-year yields when, a) rates are in an uptrend (blue) versus when rates are in a downtrend (orange).
4

Figure 4 – Cumulative move in 10-year yields if interest rate trend is UP (blue) or DOWN (orange)

You can see the large rise in rates from the 1950’s into the 1980’s in the blue line as well as the long-term decline in rates since that time in the orange line.  You can also see the recent whipsaw at the far right of the blue line.

Summary

Where do rates go from here?  It beats me.  As long as the 10-year yield holds below its long-term average I for one will give the bond bull the benefit of the doubt.  But when the day comes that 10-year yields move decisively above their long-term average it will be essential for bond investors to alter their thinking from the mindset of the past 30+ years, as in that environment, long-term bonds will be a difficult place to be.

And that won’t be easy, as old habits die hard.
5

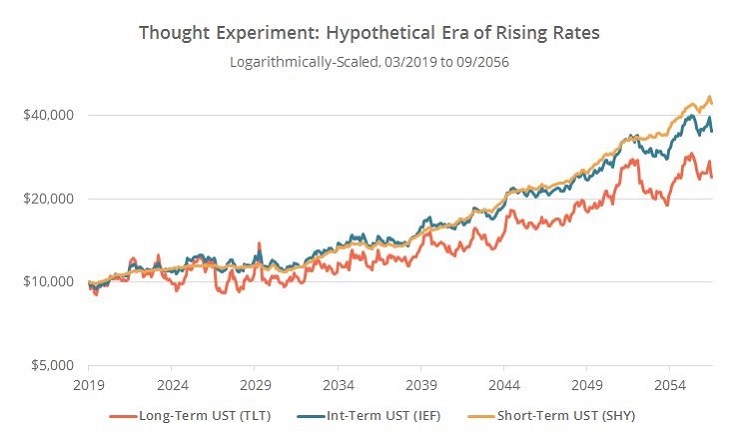
Figure 5 is from this article from BetterBuyandHold.com and displays the project returns for short, intermediate and long term bonds if rates were to reverse the decline in rates since 1982.Figure 5 – Projected total return for short, intermediate and long-term treasuries if rates reverse decline in rate of past 30+ years (Courtesy: BetterBuyandHold.com)

When rates finally do establish a new rising trend, short-tern and intermediate term bonds will be the place to be.  When that day will come is anyone’s guess.  But the 10-year yield/120mo EMA method at least we have an objective way to identify the trend shortly after the fact.

Jay Kaeppel

Disclaimer:  The data presented herein were obtained from various third-party sources.  While I believe the data to be reliable, no representation is made as to, and no responsibility, warranty or liability is accepted for the accuracy or completeness of such information.  The information, opinions and ideas expressed herein are for informational and educational purposes only and do not constitute and should not be construed as investment advice, an advertisement or offering of investment advisory services, or an offer to sell or a solicitation to buy any security.
Trend-Following in One Minute a Month (A Quick Update)

This article is intended to be a quick update to this article.  The original idea is based on the theory propounded by Ken Fischer that suggests that one should not worry about a “top” in the stock market until after the market goes at least 3 months without making a new high.

Three things to note:

*Like all trend-following methods the one detailed in the linked article will experience an occasional whipsaw, i.e., a sell signal at one price followed some time later by a new buy signal with the market at a higher price.

*Like any good trend-following method the real purpose is to help you avoid some significant portion of any major longer-term bear market, i.e., 1973-74, 2000-2002, 2007-2009).

*The secondary purpose is to relieve an investor of that constant “Is this the top, wait, what about this this, this looks like the top, OK never mind, but this, this time it definitely has to be the top” syndrome.

The Rules

For a full explanation of the rules please read the linked article.  In general, though:

*A “Sell alert” occurs when the market makes a 6-month high, then goes 3 full calendar months without piercing that high

*The “trigger” price is the lowest low for the 3 months following the previous high

*A “Sell signal” occurs at the end of the month IF the “trigger” price is pierced to the downside during the current month

*The “trigger” is no longer valid if the S&P 500 makes a high above the high for the previous 6 months prior to an actual “Sell signal”

*If a “Sell signal” occurs then a new “Buy signal” occurs when the S&P 500 makes a high above the high for the previous 6 months

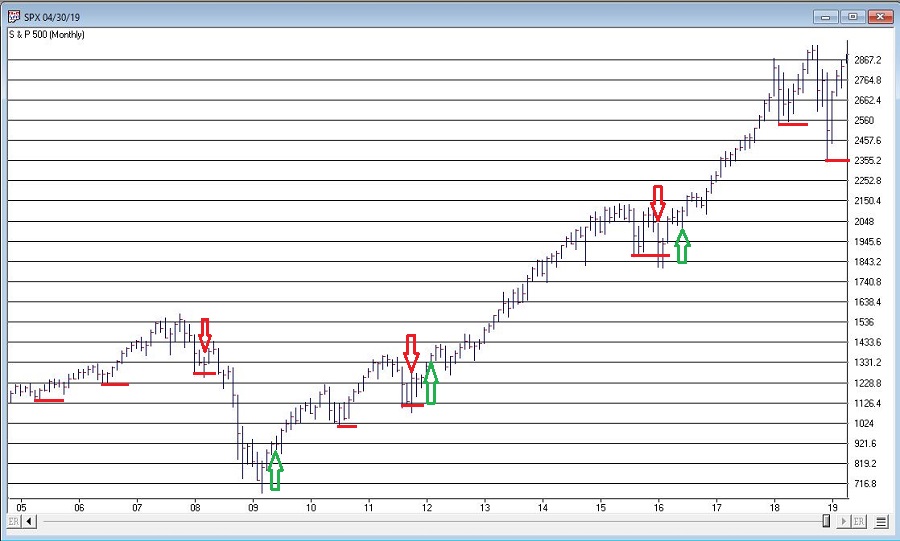
Sounds complicated, but its’s not.  Figure 1 displays the signals and alerts and trigger prices since 2005.

Green Arrows = Buy Signal

Red Arrows = Sell Signal

Red horizontal lines = Sell trigger price

1

Figure 1 – One Minute a Month Trend-Following Alerts, Trigger prices and Signals (Courtesy AIQ TradingExpert)

Note that actual sell signals occurred in 2008, 2011 and 2015.  The signal in 2008 was a life-saver, while the signals in 2011 and 2015 resulted in small whipsaws.  Sorry folks, that’s just the nature of the beast.

Interestingly, there have been two “Sell alerts” in the last year.  The first occurred at the end of April 2018, however, that alert was invalidated at the end of August 2018 when the S&P 500 pierced the previous 6-month high.  Another alert occurred at the end of December 2018.  The “Trigger price” is the December 2018 low of 2346.58.  That trigger is still active but could be invalidated if the month of May 2019 makes a high above whatever the high for April 2019 turns out to be.

The key point here is that despite the volatility and painful sell-offs in October and December of 2018, the “system” has remained on a buy signal.

Where to from here?  We’ll just have to wait and see.

Jay Kaeppel

Disclaimer:  The data presented herein were obtained from various third-party sources.  While I believe the data to be reliable, no representation is made as to, and no responsibility, warranty or liability is accepted for the accuracy or completeness of such information.  The information, opinions and ideas expressed herein are for informational and educational purposes only and do not constitute and should not be construed as investment advice, an advertisement or offering of investment advisory services, or an offer to sell or a solicitation to buy any security.
How to Succeed in Trading (by Really, Really Trying)

Sometimes it’s good to go back to the basics.  So here goes.

Trading success comes from a “reality based” approach.  It is NOT about “all the money I am going to make!”  It IS about “formulating a plan” (see the questions below) AND “doing the right thing over and over and over again” (no matter how uncomfortable or unsexy those “things” may be).

Steps to Trading Success

Trading success comes from:

A) Having answers to the questions below

B) Remembering the answers through all of the inevitable ups and downs

What vehicles will you trade?

Will it be stocks, ETFs, mutual funds, futures, options, or something else?  If you plan to trade futures or options understand that you will need a different account and/or approval from your brokerage firm.  Likewise, note that you will need to learn about the unique quirks of futures and options BEFORE you start trading.

How much money will you commit to your trading account?

Whatever that amount is be sure to put the entire amount into your account.  DO NOT make the mistake of saying “I only have x$’s but I am going to trade it as if it were y$’s.  One good drawdown and you will pull the plug.

How much money will you commit to a single trade/position?

We are NOT talking here about how much of a loss you are willing to endure.  We are simply talking about how much you will omit to the enter the trade.  If you put 10% of your capital into a given stock or ETF that doesn’t mean you are going to risk the entire amount.  This question has more to do with determining how diversified you will be.

How much money will you risk on a given trade/position?

Think in terms of percentages.  I will risk 1%, 2%, 5%, 10%, whatever.  There is no magic, or correct, number. But think of it this way – “if I experience 5 consecutive losing trades how much will my account be down?”  If you can’t handle that number then you need to reduce your risk per trade.

How many different positions will I hold at one time?  What is my maximum?

Buying and holding a portfolio stocks is different than actively trading. For active traders, holding a lot of positions at one time can be taxing – much more so than you might expect going in.  Don’t learn this lesson the hard way.

Do you understand the mechanics of entering trading orders?

The vast majority of trading orders are placed on-line.  Each brokerage firm has their own websites/platforms and each has their unique characteristics.  “Paper trading” an be a disaster if you come away thinking you “have the touch” when it comes to making money.  However, when it comes to learning the in’s and out’s of order placement BEFORE you actually start trading, it an be invaluable.

(Think of trading as sky diving and paper trading as watching virtual sky diving on your laptop.  You get the idea, but the actual experience is significantly different).

What will cause me to enter a trade?

There are roughly a bazillion and one ways to trigger a “buy signal”.  Some are great, some are awful, but the majority are somewhere sort of in the middle.  Too many traders spend too much time looking for “that one great method”: of triggering signals.  The truth is that if you allocate capital wisely, manage your risk (more to follow) the actual method you use to signal trades is just one more piece of the puzzle – NOT the be all, end all.

How will I enter a trade?

This sounds like the same question as the one above, but it is different.  For an active trader, a buy signal may occur but he or she may wait for “the right time” to actually enter the market.  For example, if an “oversold” indicator triggers a “buy” signal, a trader may wait until there is some sort of price confirmation (i.e., a high above the previous trading day, a close above a given moving average, etc.) rather than risking “trying to catch a falling safe.”

What will cause me to exit a trade with a loss?

The obvious one is a loss that reaches the maximum amount you are willing to risk per trade as established earlier.  But there can be other factors.  In some cases, if the criteria that caused you to enter the trade in the first place no longer is valid, it can make sense to “pull the plug” and move on to another opportunity.  A simple example: you buy because price moves above a given moving average.  Price then drops back below that moving average without reaching your “maximum loss” threshold.

What will cause you to exit a trade with a profit?

This one is easy to take for granted.  Too many traders think, “Oh, once I get a decent profit I’ll just go ahead and take it.”  But a lot depends on the type of methodology that you are using.  If you are using a short-term trading system that looks for short-term “pops” in the market, then it might male sense to think in terms of setting “profit targets” and getting out while the getting is good.  On the other hand, if you are using a trend-following method you will likely need to maintain the discipline to “let your profits run” in order to generate the big winning trades that virtually all trend-following methods need in order to offset all of the smaller loses that virtually all trend-following methods experience.

The problem comes when a short-term trader decides to “let it ride” or when a trend follower starts “cutting his or her profit short” by taking small profits.

Different Types of Trading Require a Different Mindset

Putting money into a mutual fund or a portfolio of stocks is far different than trading futures or even options.  While you can be “hands on” with funds or stocks it is not necessarily a requirement (I still hold a mutual fund that I bought during the Reagan administration).  With futures or options, you MUST be – and must be prepared to be – hands on.

Also, big percentage swings in equity are more a way of life in futures and options.  I like options because they give you the ability to risk relatively small amounts of capital on any variety of opportunities – bullish, bearish, neutral, hedging and so forth.

I also like futures, but it does require a different level of emotional and financial commitment than most other forms of trading.  Many years ago, I wrote about the following “Litmus Test for Futures Traders”.  It goes like this:

To tell if you are prepared emotionally and financially to trade futures doe the following.

1. Got to your bank on a windy day.

2.  Withdraw a minimum of $10,000 in cash

3. Go outside and start throwing your money up into the air until it all blows away

4. Go home and get back to your routine like nothing ever happened.

If you can pass this test then you are fully prepared to trade futures.  If you cannot pass this test it simply means that you need to go into it with your eyes wide open regarding the potential risks (with the knowledge that something similar to what was just described can happen at any time).

Summary

In a perfect world a trader will have well thought out and detailed answers to all of the questions posed above BEFORE they risk their first dollar.

Jay Kaeppel

Disclaimer:  The data presented herein were obtained from various third-party sources.  While I believe the data to be reliable, no representation is made as to, and no responsibility, warranty or liability is accepted for the accuracy or completeness of such information.  The information, opinions and ideas expressed herein are for informational and educational purposes only and do not constitute and should not be construed as investment advice, an advertisement or offering of investment advisory services,

Too Soon to Get Sweet on Sugar

One of my (admittedly, potentially foolish) beliefs is that commodities will outperform stocks again someday.  Possibly someday starting soon (roughly defined as anywhere from today to a year from today) and that the shift will be dramatic and last for a period of 3 to 8 years.

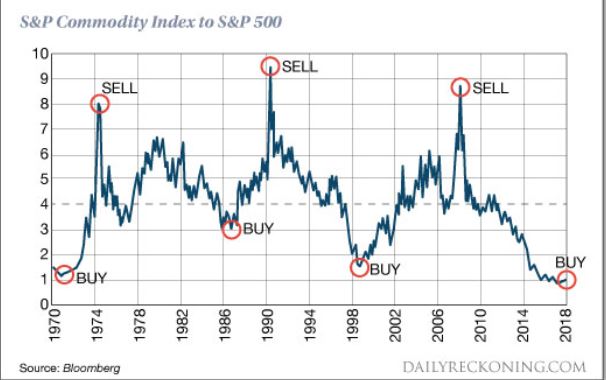
And no, I don’t think I could be any more vague.  But I haven’t really “taken the plunge” (i.e., shifted money from the stock market into commodities in any meaningful way) yet.  But I am keeping a close eye on things.  Rather than rattled off another 1,000 words to explain, I will simply refer you to Figure 1 that tracks the ratio of the S&P Commodity Index to the S&P 500 Index.

1

Figure 1 – Commodities versus Stocks (Source: www.DailyReckoning.com)

History suggests that “the worm will (eventually) turn.”

Sugar

2

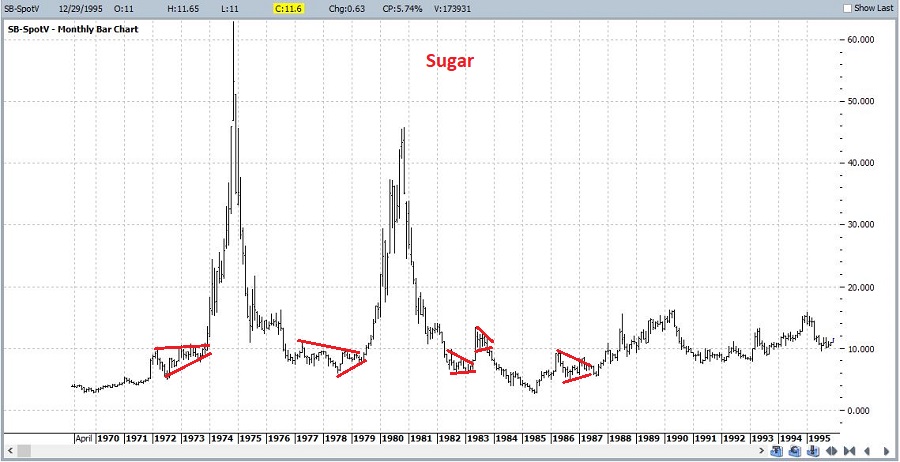
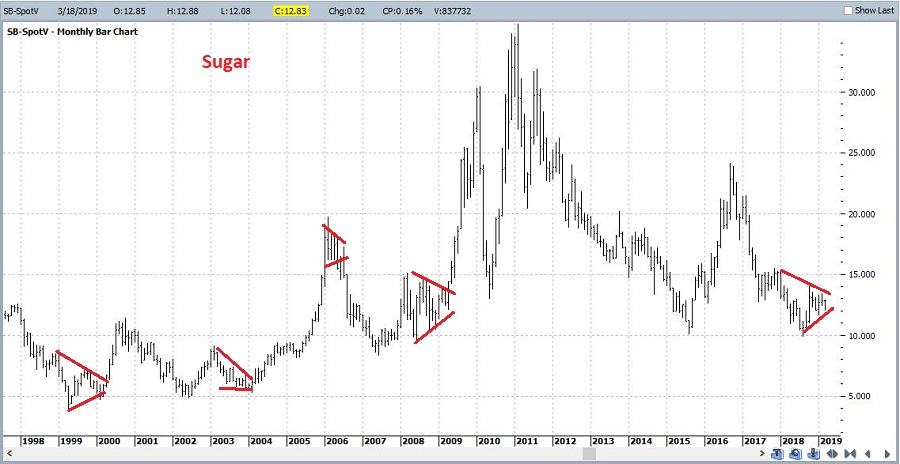
Let’s focus on one commodity for now.  Sadly, it’s one of my favorites (ranks right up there with coffee).  Sugar.  As you can see in Figures 2 and 3, sugar has a history of contracting in price over a period of time and then alternately – and please excuse my use of the following overly technical terms – “swooping” or “soaring”.Figure 2 – Sugar 1970-1998 (Courtesy ProfitSource by HUBB)

3

Figure 3 – Sugar 1998-2019 (Courtesy ProfitSource by HUBB)

4

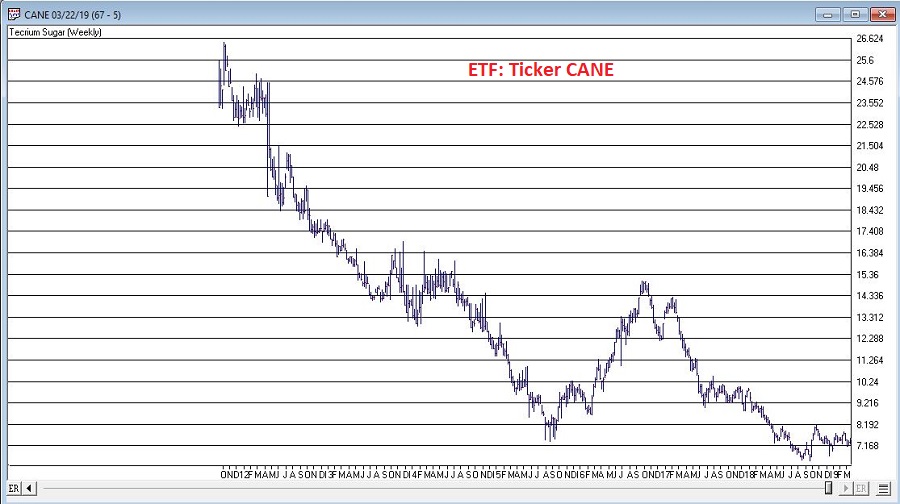
Sugar can be traded either in the futures market (each full one-point movement in price equates to $1,120 in contract value).  An alternative for “normal people” is ticker CANE which is the Teucrium Sugar ETF which trades like shares of stock.  See Figure 4.Figure 4 – ETF Ticker CANE (Courtesy AIQ TradingExpert)

As you can see, sugar has been “contracting” in price of late.  Does this mean it is reading to “swoop” or “soar”?  Possibly.  But for those who want to play the bullish side, it is probably a bit too soon to dive in.

Seasonality in Sugar

5

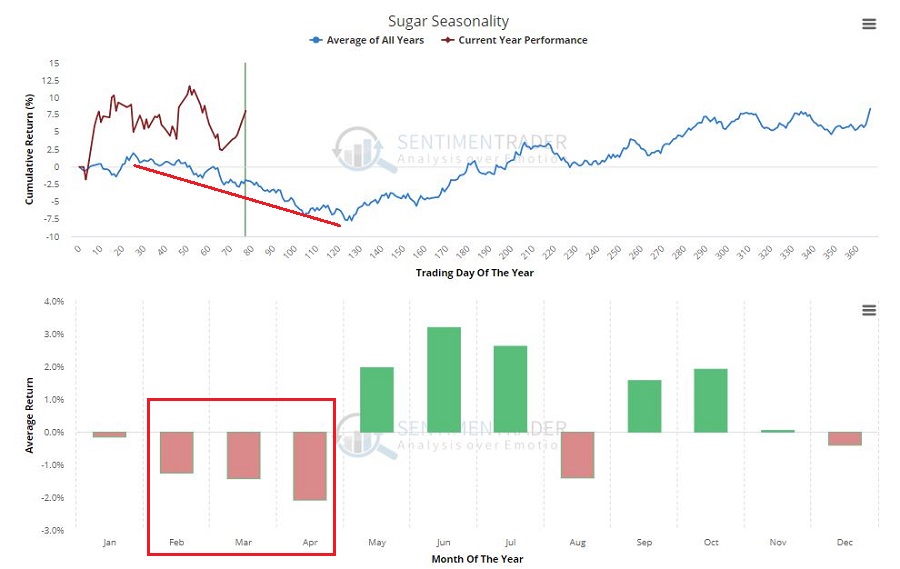
Figure 5 displays the annual seasonal trend in sugar.  It should be noted that you should NOT expect every year to follow this trend.  It is a display of previous historical tendencies and NOT a roadmap.Figure 5 – Sugar Annual Seasonal Trend (Courtesy Sentimentrader.com)

Still, the primary point is captured nicely in:

Jay’s Trading Maxim #92: One of the keys to long term success is committing capital where the probabilities are (or a least appear to be) in your favor.

February through April is NOT that time for anyone looking to play the long side of sugar.

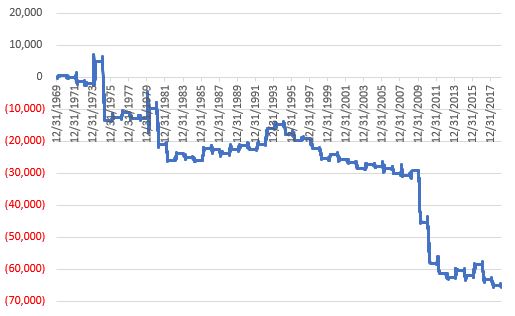
Figure 6 displays the cumulative results achieved by holding long one sugar futures contract ONLY during the months of February through April every year starting in 1970.

6

Figure 6 – Cumulative $+(-) holding long sugar futures Feb, Mar, Apr every year since 1970

Some things to note regarding sugar Feb through Apr:

*UP 18 times

*DOWN 31 times

*Average gain = +$2,201

*Average loss = (-$3,377)

*Largest gain = +$6,630 (1974)

*Largest loss = (-$18,424) (1975)

Summary

The point IS NOT to argue that sugar is doomed to plunge between now and the end of April, nor even to argue that it cannot rally strongly between now and then – because it can.

The point IS to merely point out that the odds do not presently favor the bulls, which means – well, see Trading Maxim #92 above.

Jay Kaeppel

Disclaimer:  The data presented herein were obtained from various third-party sources.  While I believe the data to be reliable, no representation is made as to, and no responsibility, warranty or liability is accepted for the accuracy or completeness of such information.  The information, opinions and ideas expressed herein are for informational and educational purposes only and do not constitute and should not be construed as investment advice, an advertisement or offering of investment advisory services, or an offer to sell or a solicitation to buy any security.
Utilities at the Crossroads

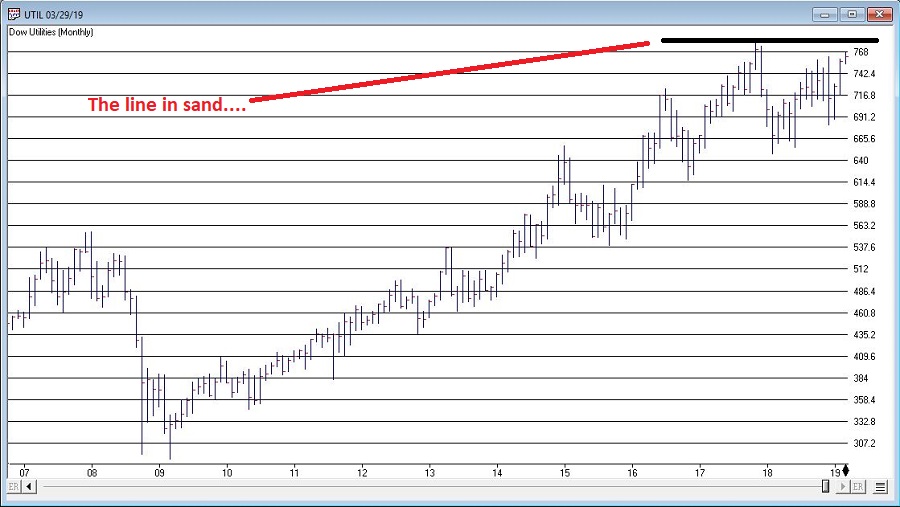
A lot of eyes are firmly fixed on Utilities at the moment.  And for good reason.  As you can see in Figure 1, the Dow Jones Utilities Average is presently facing a key resistance level.  If it breaks out above the likelihood of a good seasonal rally (more in a moment) increases significantly.

1

Figure 1 – Utilities and resistance (Courtesy AIQ TradingExpert)

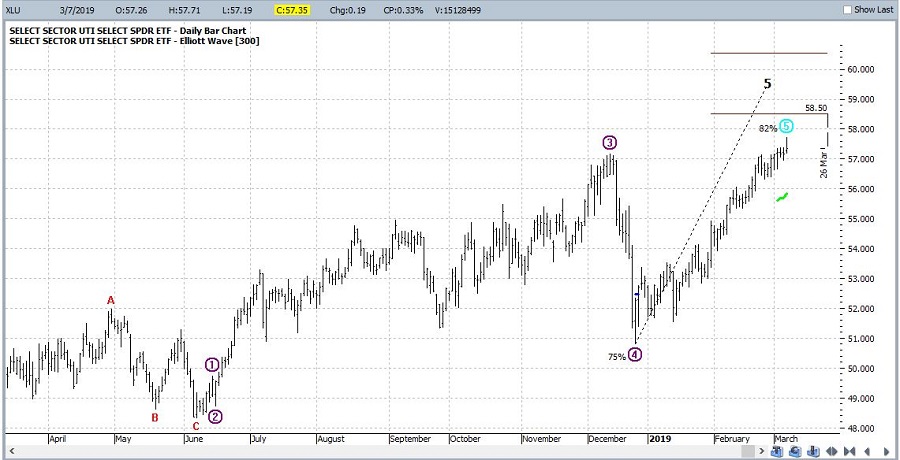
One concern may be the fact that a 5-wave Elliott Wave advance appears to possibly have about run its course (according to the algorithmically drawn wave count from ProfitSource by HUBB which I use).  See Figure 2.

2

Figure 2 – Utilities and Elliott Wave (Courtesy ProfitSource by HUBB)

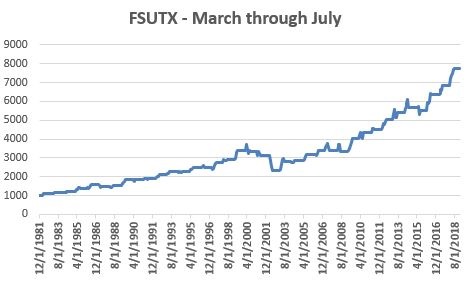
For what it is worth, the March through July timeframe is “typically” favorable for utilities.  Figure 3 displays the growth of $1,000 invested in the Fidelity Select Sector Utilities fund (ticker FSUTX) ONLY during the months of March through July each year starting in 1982.

3

Figure 3 – Growth of $1,000 invested in ticker FSUTX Mar-Jul every year (1982-2018)

For the record:

*# times UP = 29 (78%)

*# times DOWN = 8 (22%)

*Average UP = +9.3%

*Average DOWN = (-5.8%)

*Largest UP = +21.1% (1989)

*Largest DOWN = (-25.8%) (2002)

*Solid performance but obviously by no means nowhere close to “a sure thing”.

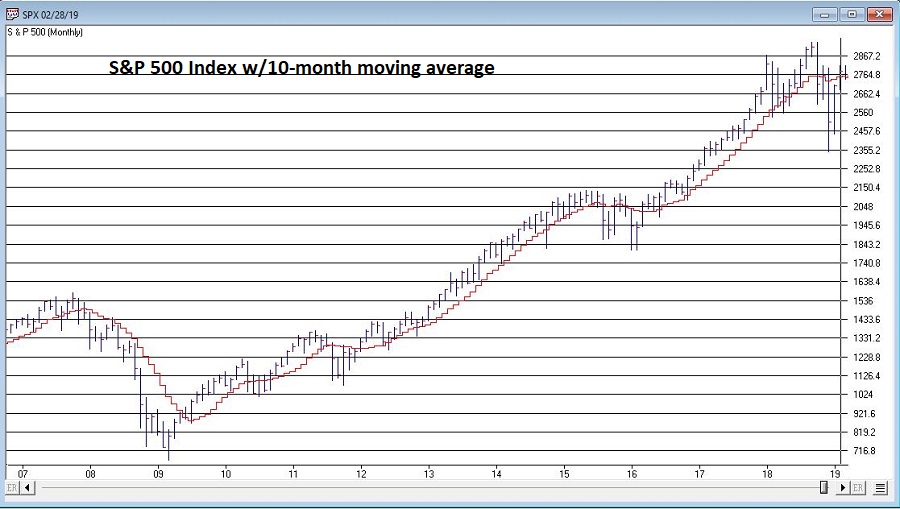
*It should be noted that several of the “Down” years occurred when the S&P 500 was already in a pretty clearly established downtrend (2001, 2002 and 2008), i.e., below its 10-month moving average.  See Figure 4.

4

Figure 4 – S&P Index w/10-month moving average (Courtesy AIQ TradingExpert)

Summary

Utilities are flirting with new all-time highs and March through July is a “seasonally bullish” period for utilities.  Does that mean “happy days are here again, and we should all be piling into utilities?  Yeah, isn’t that always the thing about the markets?  There is rarely a 100% clear indication for anything.

As always, my “prediction” about what will happen next in utilities is irrelevant and I am NOT pounding the table urging you to pile in.  But I can tell you what I am watching closely at the moment:

*The S&P 500 Index is flirting right around its 10-month moving average (roughly 2,752 on the S&P 500 Index).  If it starts to break down from there then perhaps 2019 may not pan out so well for utilities.

*The Dow Jones Utility Average is facing a serious test of resistance and may run out of steam (according to Elliott Wave).

*But a breakout to the upside could well clear the decks for utilities to be a market leader for the next several months

Focus people, focus.

Jay Kaeppel

Disclaimer:  The data presented herein were obtained from various third-party sources.  While I believe the data to be reliable, no representation is made as to, and no responsibility, warranty or liability is accepted for the accuracy or completeness of such information.  The information, opinions and ideas expressed herein are for informational and educational purposes only and do not constitute and should not be construed as investment advice, an advertisement or offering of investment advisory services, or an offer to sell or a solicitation to buy any security.