by Hank Swiencinski, AIQ TradingExpert Pro client for over 20 years, founder of ‘The Professor’s One Minute Guide to Stock Management’
Join Hank at a special one hour webinar entitled ‘The Professor’s Rifle Trade’, August 22, 2013. hank will reveal his most powerful position trading technique. Limited audience and early bird pricing. LEARN MORE
The Dow fell 8 points, closing at 15,291. Volume on the NYSE was extremely light on the decline, coming in at only 71 percent of its 10 day average. There were 194 new highs and 36 new lows.
The markets spent most of the day waiting to see what the Fed minutes said about their plans for stimulating the economy. When the minutes came out at 2pm, there was a small rally, but it died quickly leaving the Dow flat into the cloise. However after the close, Bernanke, speaking at a conference sponsored by the National Bureau of Economic Research, stated that the U.S. economy continues to need an accommodative monetary policy. This caused US futures to shoot higher in after market trading, with the Dow futures gaining over 140 points..
There was another small change in the A-D oscillator yesterday, so you could say that the oscillator was predicting the Bernanke move. The Big Move should be enough to push the Dow above the point where the odds favor the scenario that wave ‘c’ up has started. But over the past few months, we have seen several times where a ‘talked up’ markets has come back down to earth, so today’s trading should be very interesting to watch.
Bernanke’s statement also caused several of the world markets to rally overnight, including China’s Hang Seng which gained over 2 percent. So it appears that FXP will make that second low in the Blade that I talked about yesterday. Same for EEV as the Bovespa is currently trading up almost one percent. BTW, the 60s remained negative yesterday on both FXP and EEV, so my Rifle Trade on the ETFs was never triggered.
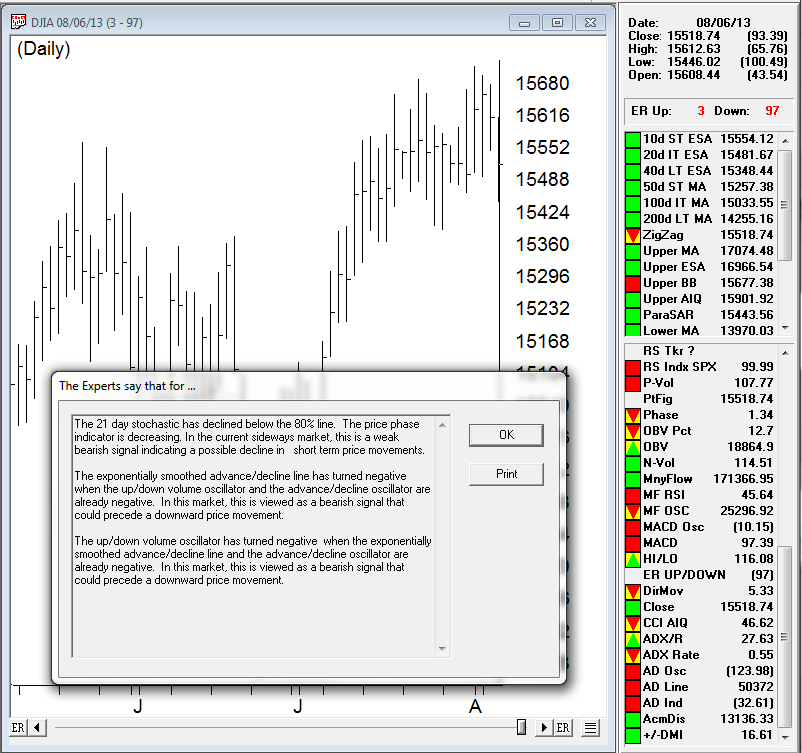
I spent a few hours last night looking at the volume data on several of the indexes, and what I saw was not pretty picture. The P-Volume, Volume Accumulation Percent and On Balance Volume on the Dow (DIA) remain very negative, despite the past week’s advance. And while two of the three same indicators on the Nasdaq (QQQ) are positive, they are showing significant divergences with price. This problem with volume could all change if the overnight spike rally continues to be supported in the next few days. But right now, it’s very hard for me to believe that the rally will stick on such negative and diverging volume.
Also, the pattern is somewhat troubling to me as well if wave ‘c’ up is starting. Up until last night, the pattern on the Dow looked more like an a-b-c move coming off the 24 June low of 14, 551. But after last night’s spike rally, the c wave of that a-b-c move will start to look impulsive, meaning that it’s starting to appear more like a wave 3 up than a wave c. This too would strongly argue that wave 1 up of wave ’c’ is underway.
The Dow high of 15,542 made on 22 May should provide significant resistance to any rally built on Bernanke’s words. So even if we do pop, I would expect the markets to pull back to form a better pattern before they have enough strength to support a further advance. If the volume starts to improve, and the market pulls back, that’s where I’ll look to go long. Not now.
Remember, wave ‘c’ up should be the final wave in the three wave sequence for Major Wave E up that started back in November 2012. And once this wave completes, there will not be any more up major waves in the Ending Diagonal Pattern for a long time. So please, pay attention to the Dean’s List during the next few months. As long as the Dean remains positive, odds are that the markets will continue to push higher as final wave ‘c’ of Major Wave E starts to unfold.
If this starts to happen, I will be trading this final wave up the same way that I traded the ‘a’ wave that occurred from January into late May with Rifle Trades. As we prepare for this, you might want to take a look at a stock like GILD on the Daily’s. I’m not saying that GILD is the stock I will be looking to trade. It’s only an example of what you should be looking for. Note how GILD has been in a steady Uptrend since April 2012. Notice too how the PT indicators remained positive for most of that time. Then after you have done this, remove all of the PT indicators so your chart just contains the price and a 2-period RSI Wilder. What I want you to see is how many opportunities you had to go ‘hunting’ on GILD. And how many of those trades resulted in profits of 5-6 points.
So don’t worry about today’s spike rally. If it’s part of wave 1 up of ‘c’ up there will be plenty of opportunities to go hunting…at a much lower risk. Right now, all I’m doing is polishing my Rifle.
That’s what I’m doing,
h