In a recent Zoom meeting, Steve Hill, CEO of AIQ Systems, shared Bollinger Bands Setups, Variations & Trade Timing. In this article, we’ll expand on using %B and creating custom indicators to help identify trade setups using Bollinger Bands and %B.
When John Bollinger introduced Bollinger Bands in the 1980s, traders gained a powerful visual tool for understanding market volatility and potential turning points. But tucked away inside the Bollinger Band toolkit is a lesser-known gem: %B.
If Bollinger Bands are the map, %B is the GPS — it tells you exactly where price is, relative to the bands, at any given time. This extra precision can help you spot breakouts, reversals, and trend confirmations faster.
What is %B?
%B measures the position of the last closing price within the Bollinger Band range.

- %B = 1.0 → Price is exactly at the upper Bollinger Band.
- %B = 0.0 → Price is exactly at the lower Bollinger Band.
- %B > 1.0 → Price is above the upper band (potential breakout or overbought).
- %B < 0.0 → Price is below the lower band (potential breakdown or oversold).
Why Use %B Instead of Just the Bands?
While the bands themselves are great for visual trading, %B turns them into a precise numeric oscillator that’s perfect for:
- Coding trading systems (like in AIQ’s Expert Design Studio).
- Screening for setups in thousands of stocks.
- Backtesting with exact entry/exit rules rather than “eyeballing” the chart.
Five Ways to Use %B in Trading
1. Overbought/Oversold Mean Reversion
- Buy when %B < 0.05 (price hugging lower band) and momentum turns up.
- Sell when %B > 0.95 (price hugging upper band) and momentum turns down.
2. Trend Breakouts
- Buy when %B crosses above 1.0 (price breaks above upper band in an uptrend).
- Sell when %B crosses below 0.0 (price breaks below lower band in a downtrend).
3. Band “Walks”
In strong trends, price can “walk” the band.
- In an uptrend, %B will often stay above 0.8 for extended periods.
- In a downtrend, %B will often stay below 0.2.
For AIQ TradingExpert Pro, we’ll create an EDS strategy that looks for all these setups and generates two indicators.
%B as a histogram in Charts, and a Walk the BBands indicator, where we’ll create upper and lower thresholds, where we can see %B stays above or below these thresholds for several days.
Example Setups from the EDS scan 8-1-2025
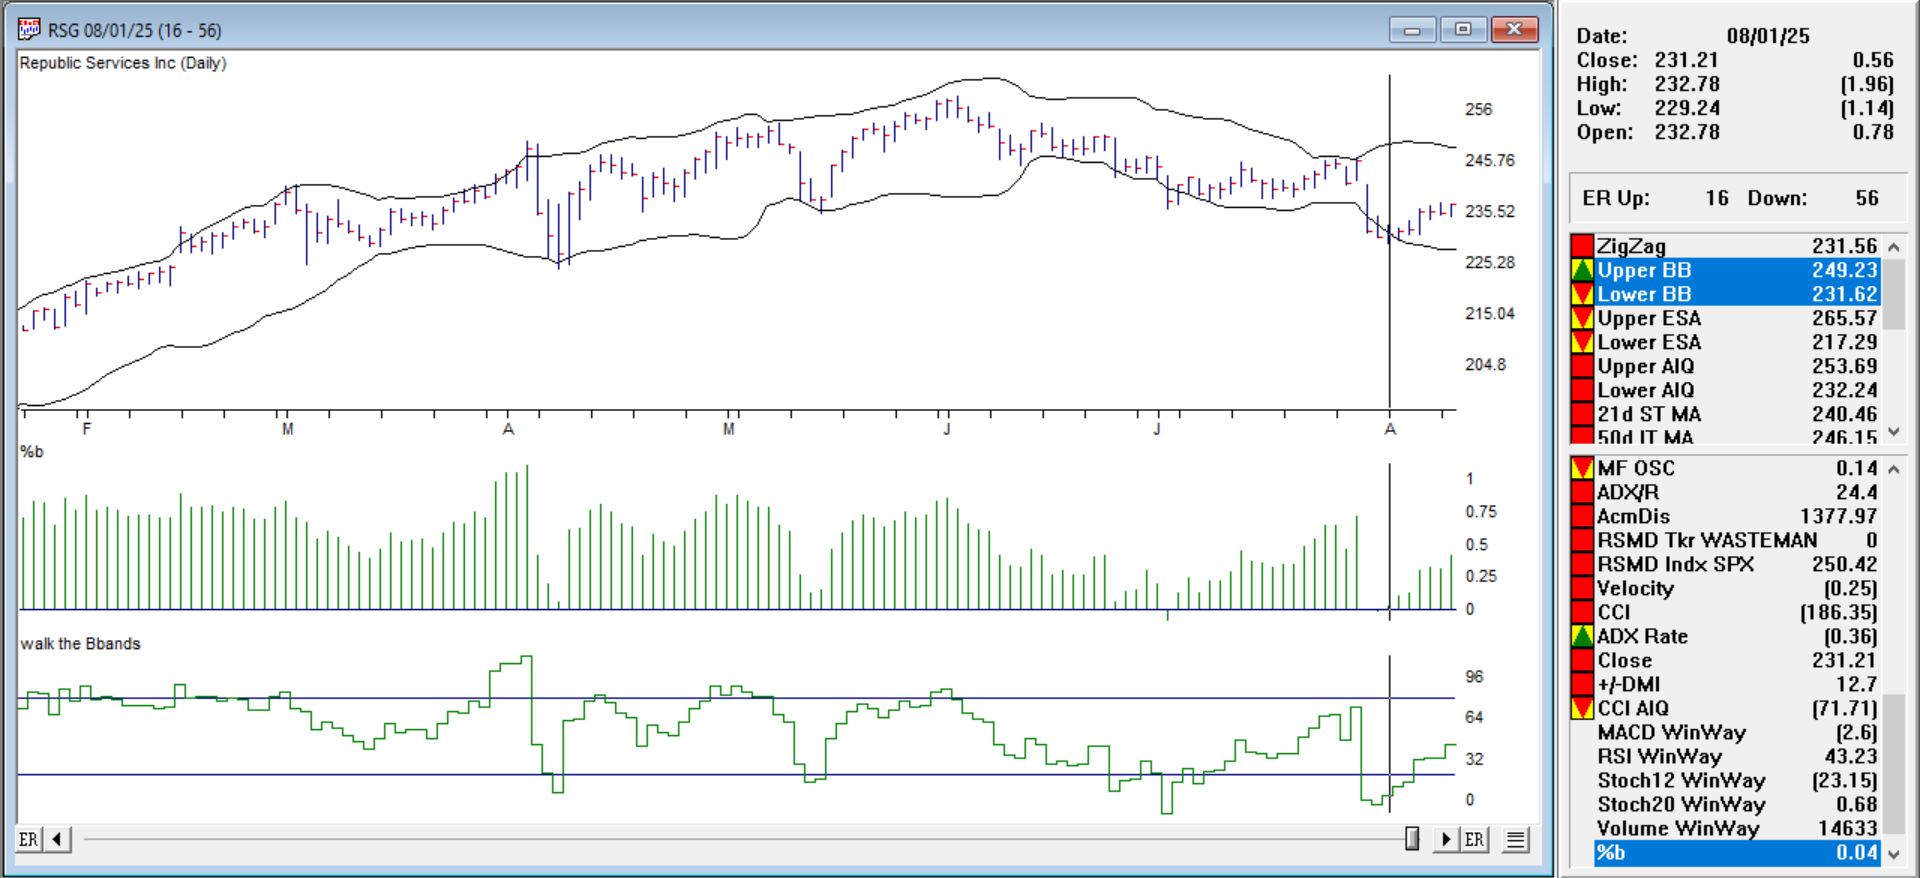
Buy when %B < 0.05 (price hugging lower band) and momentum turns up. Ticker RSG %B histogram is 0.05 8-1-25, prices moved moderately up.
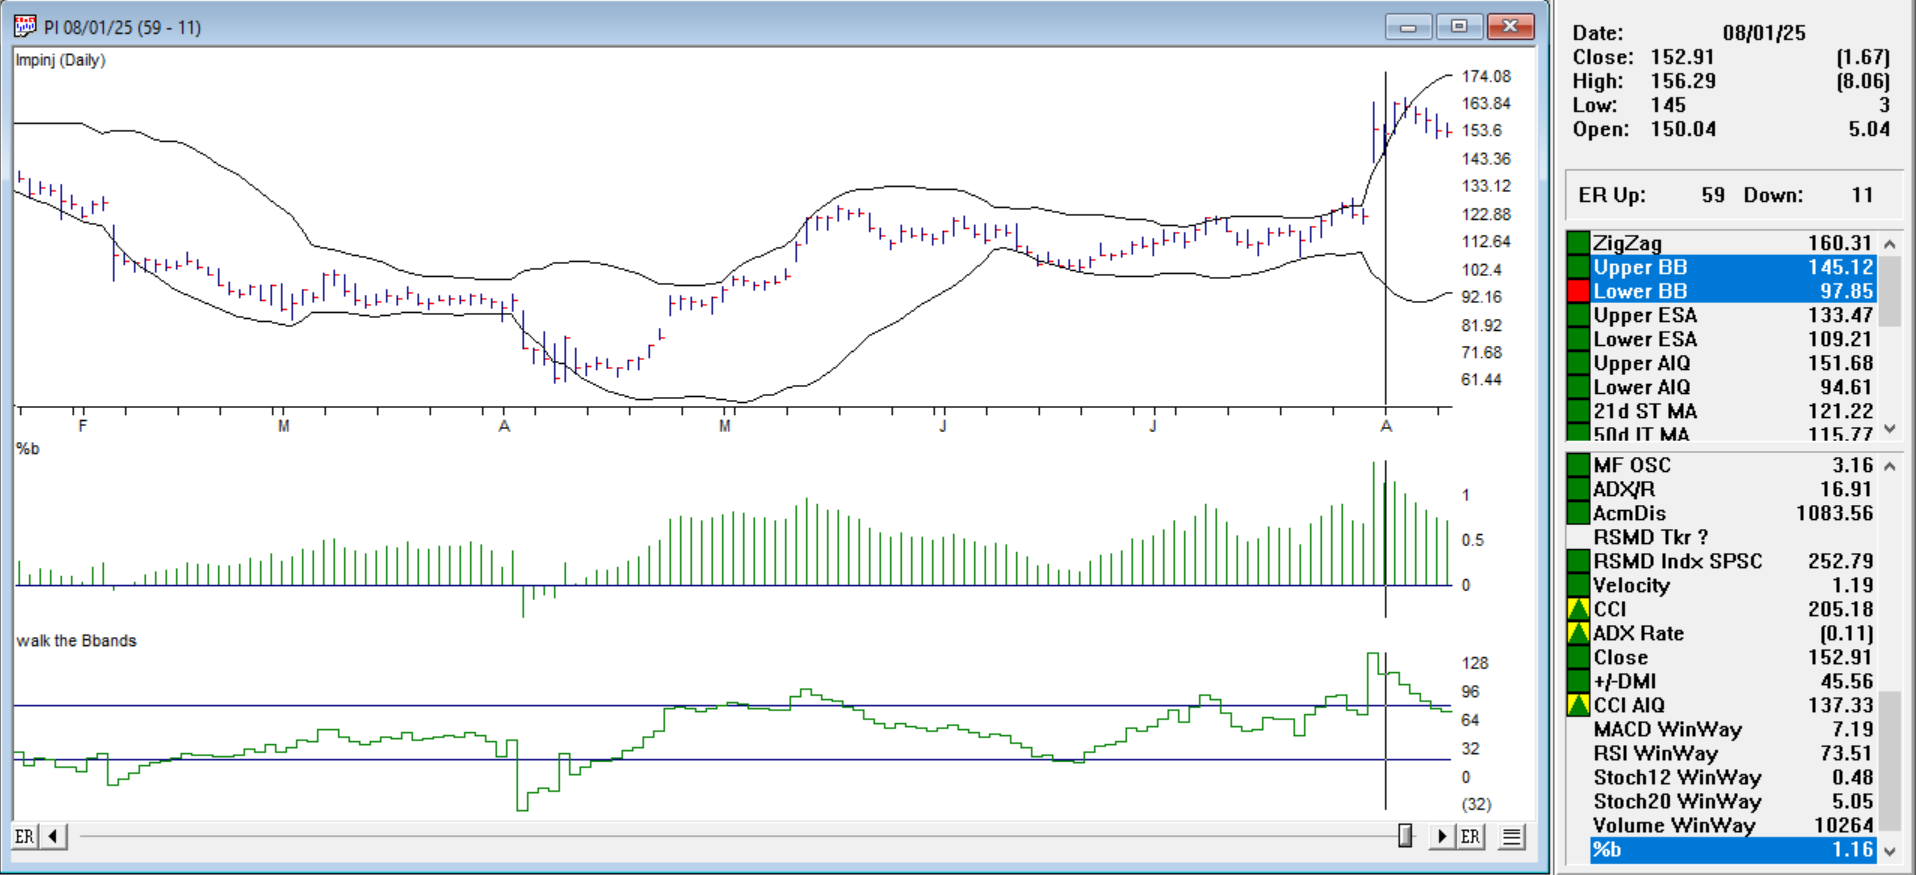
Sell when %B > 0.95 (price hugging upper band) and momentum turns down. Ticker PI %B histogram is 1.16, prices turned down.
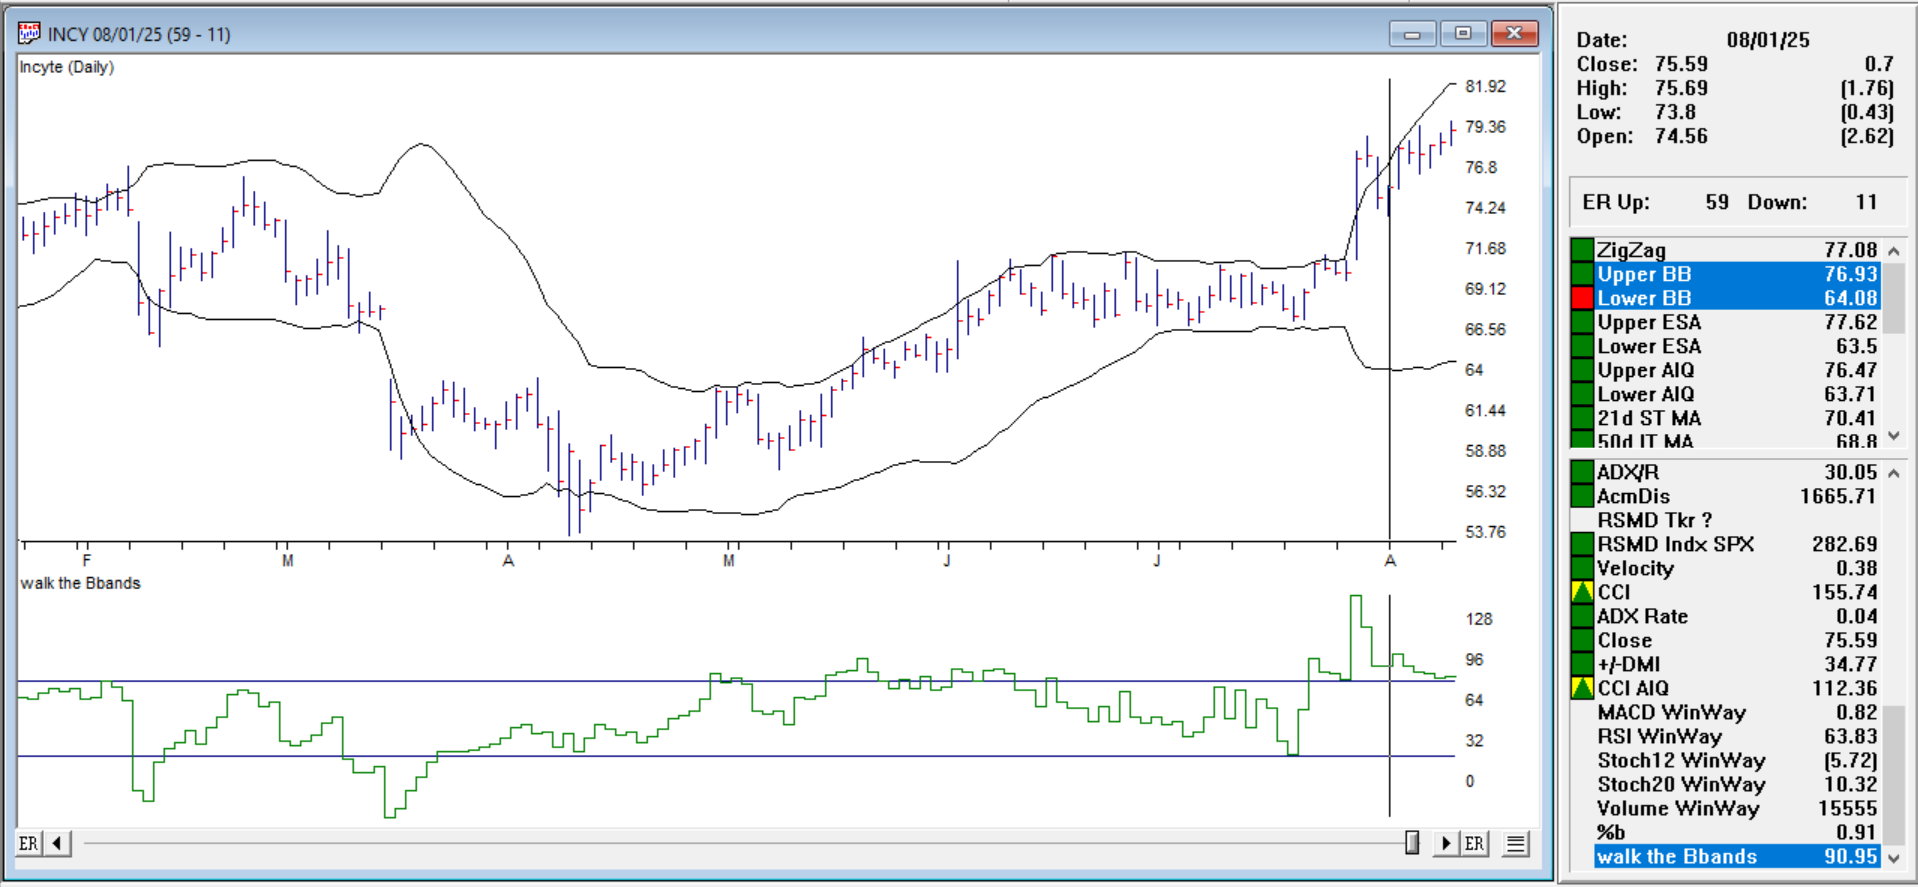
Walk the band up. In an uptrend, %B will often stay above 0.8 for extended periods. Ticker INCY shows above our 80 line in the Walk the BBands indicator and continues to do so.
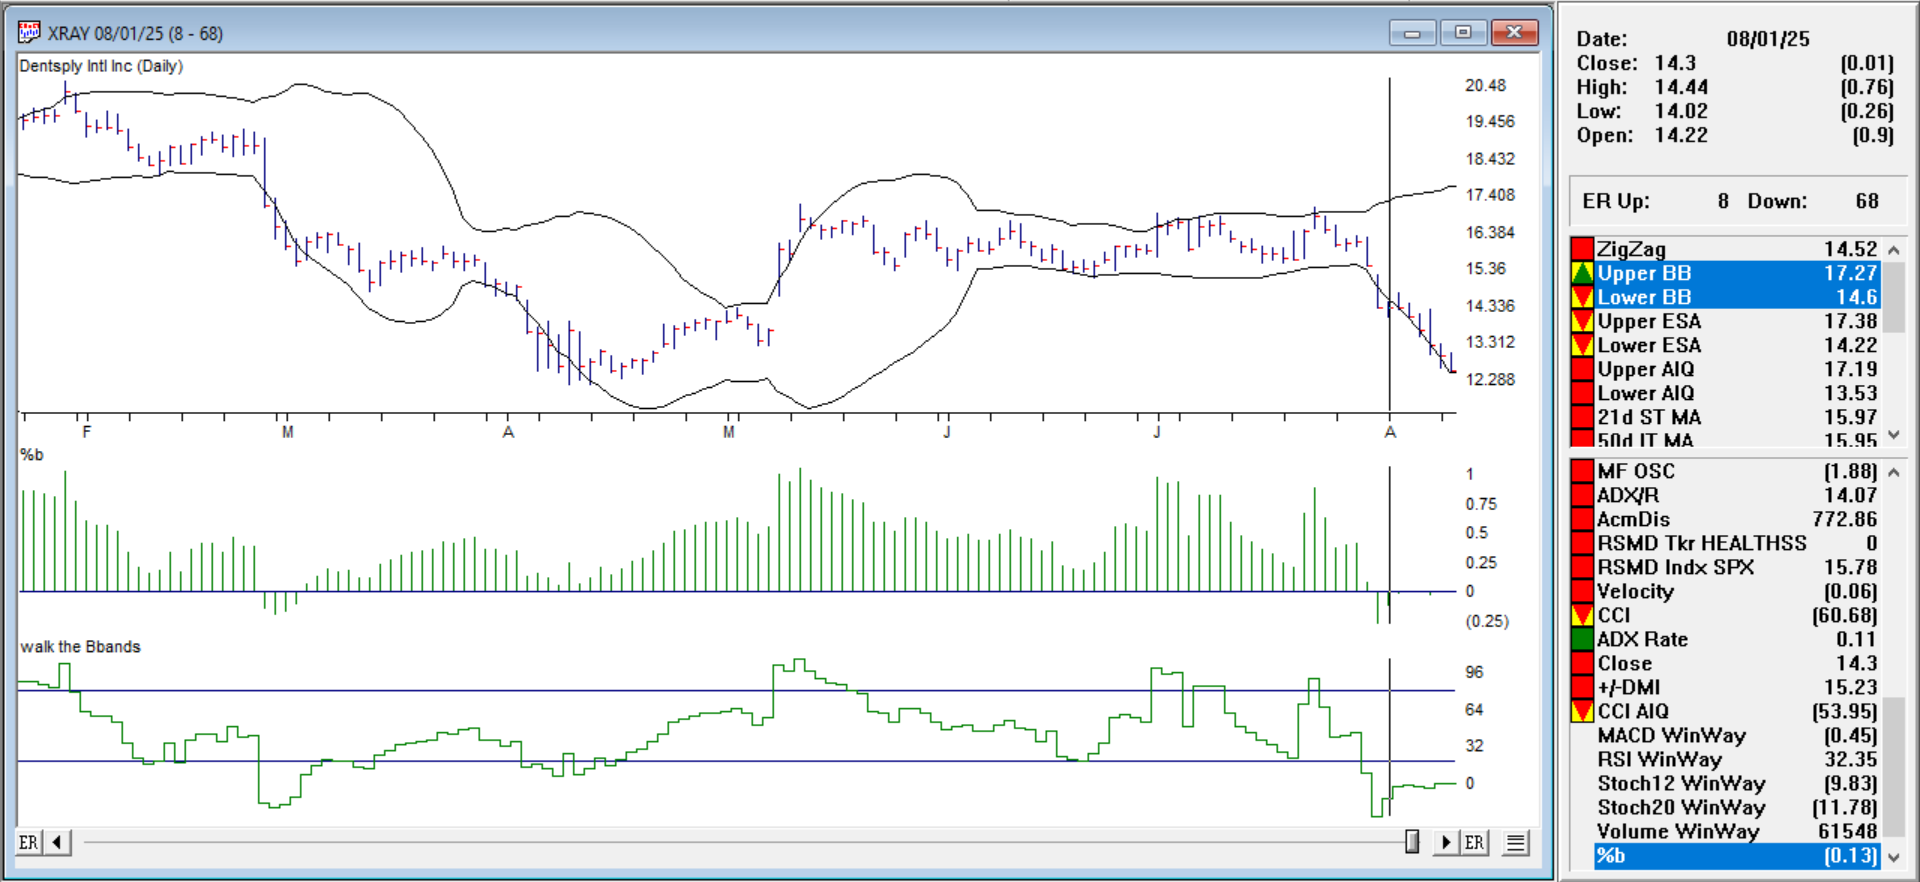
Walk the band down. In a downtrend, %B will often stay below 0.2. Ticker XRAY shows below our 20 line in the Walk the BBands indicator and continues to do so.
Click here to download this zipped EDS file. Locate the Bollinger%25B.zip file usually in your downloads folder and extract the Bollinger%25B.EDS file to your /wintes32/EDS strategies folder.
The code is below
EDS code
! — How to Use the %B Indicator for Smarter Trading
! — When John Bollinger introduced Bollinger Bands in the 1980s, traders gained
! — a powerful visual tool for understanding market volatility and potential turning points.
! — It tells you exactly where price is, relative to the bands, at any given time.
! — This extra precision can help you spot breakouts, reversals, and trend confirmations faster.
Periods is 20.
Multiplier is 2.
! Step 1: Moving Average of Close
MA20 is simpleavg([close],Periods).! Step 2: Squared Deviations from MA
Deviation is ([close] - MA20) * ([close] - MA20).! Step 3: Average of Squared Deviations
Var20 is simpleavg(Deviation,Periods).! Step 4: Square Root to get Standard Deviation
SD20 is sqrt(Var20).! Step 5: Upper and Lower Bands
UpperBand is MA20 + Multiplier * SD20.
LowerBand is MA20 - Multiplier * SD20.
! Step 6: %B Calculation
PercentB is ([close] - LowerBand) / (UpperBand - LowerBand).! — Buy when %B < 0.05 (price hugging lower band) and momentum turns up.
BuyReversal if PercentB < 0.05 and [close] > val([close],1).! — Sell when %B > 0.95 (price hugging upper band) and momentum turns down.
SellReversal if PercentB > 0.95 and [close] < val([close],1).! — Buy when %B crosses above 1.05 (price breaks above upper band in an uptrend).
BuyBreakout if PercentB > 1.05.! — Sell when %B crosses below -0.05 (price breaks below lower band in a downtrend).
SellBreakdown if PercentB < -0.05.! — create an indicator for walking the bands use a one line indicator with upper at 80 lower at 20 by %B x100
walkindicator is PercentB*100.! — Band “Walks” in strong trends up, price can walk, the band %B will often stay above 0.8 for extended periods.
walkuptoday if walkindicator>80.
walkup1ydy if valresult(walkindicator,1)>80.
walkup2back if valresult(walkindicator,2)>80.
wlkupfor3days if walkuptoday and walkup1ydy and walkup2back.
! — Band “Walks” in strong trends down, price can walk, the band %B will often stay below 0.2 for extended periods.
walkdowntoday if walkindicator<20.
walkdown1ydy if valresult(walkindicator,1)<20.
walkdown2back if valresult(walkindicator,2)<200.
wlkdownfor3days if walkdowntoday and walkdown1ydy and walkdown2back
Adding the %B and Walking the BBands Indicator
Open Charts.
Go to Chart → Settings → Indicator Library → EDS Indicators.
Click Add.
Select the Bollinger%25B.EDS file from your /wintes32/EDS strategies folder and click Open.
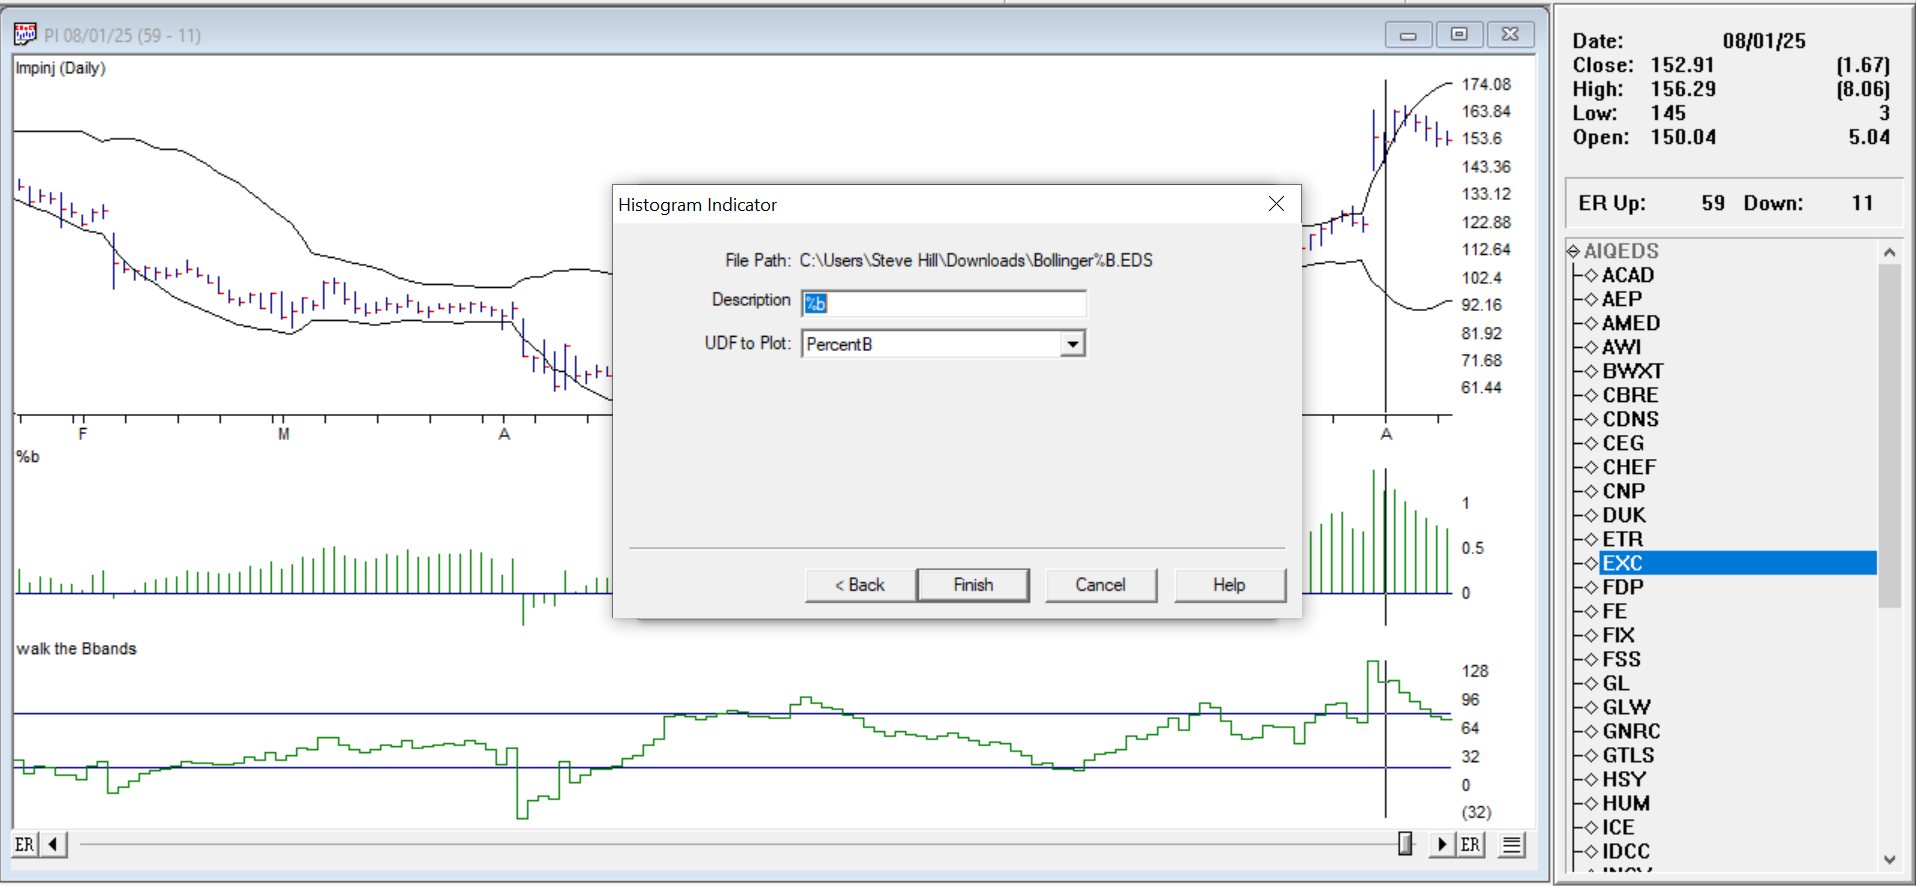
Choose a Plot Type Histogram for %B
Give it a Description/Name, then choose the UDF to Plot (PercentB).
Click Finish, then Done. Your new indicator now appears in the Indicator Library and can be added to charts like any other study.
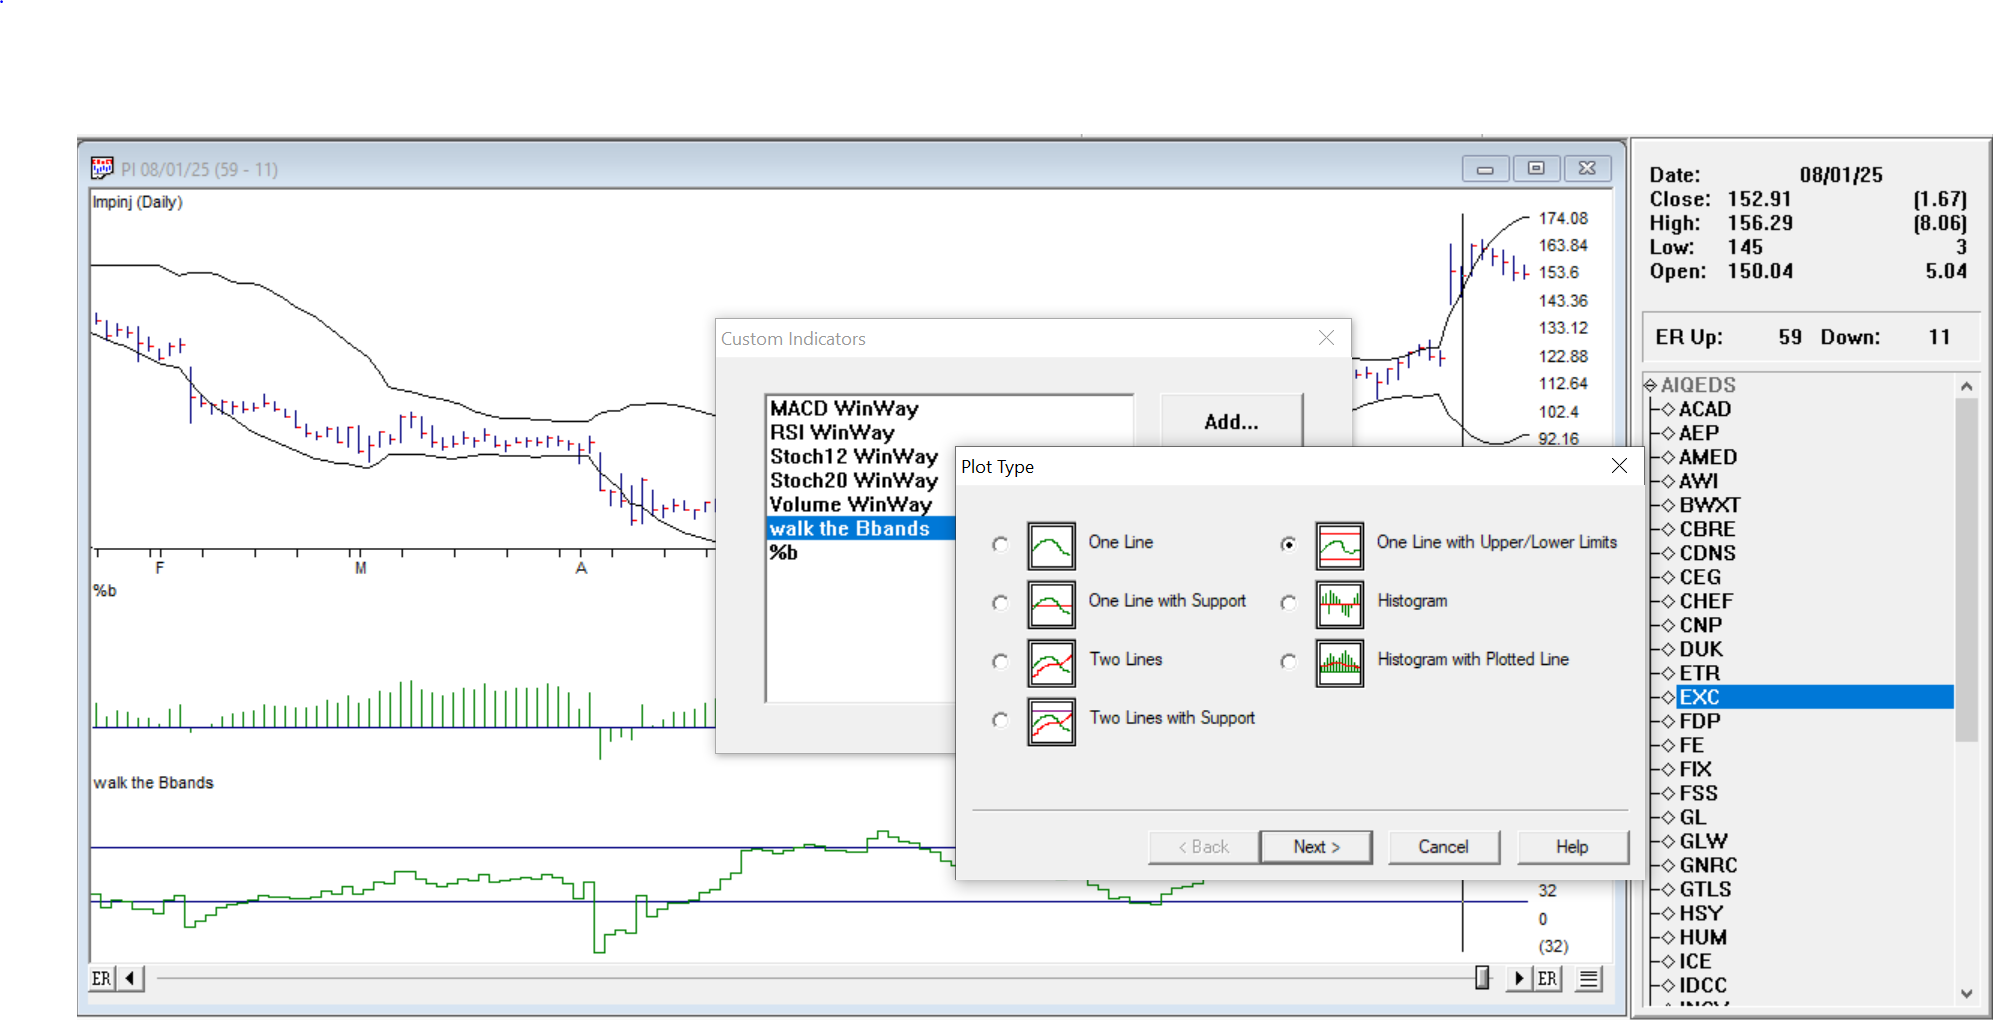
Repeat for the Walk the BBands but select Plot Type One Line with Upper/Lower Limits
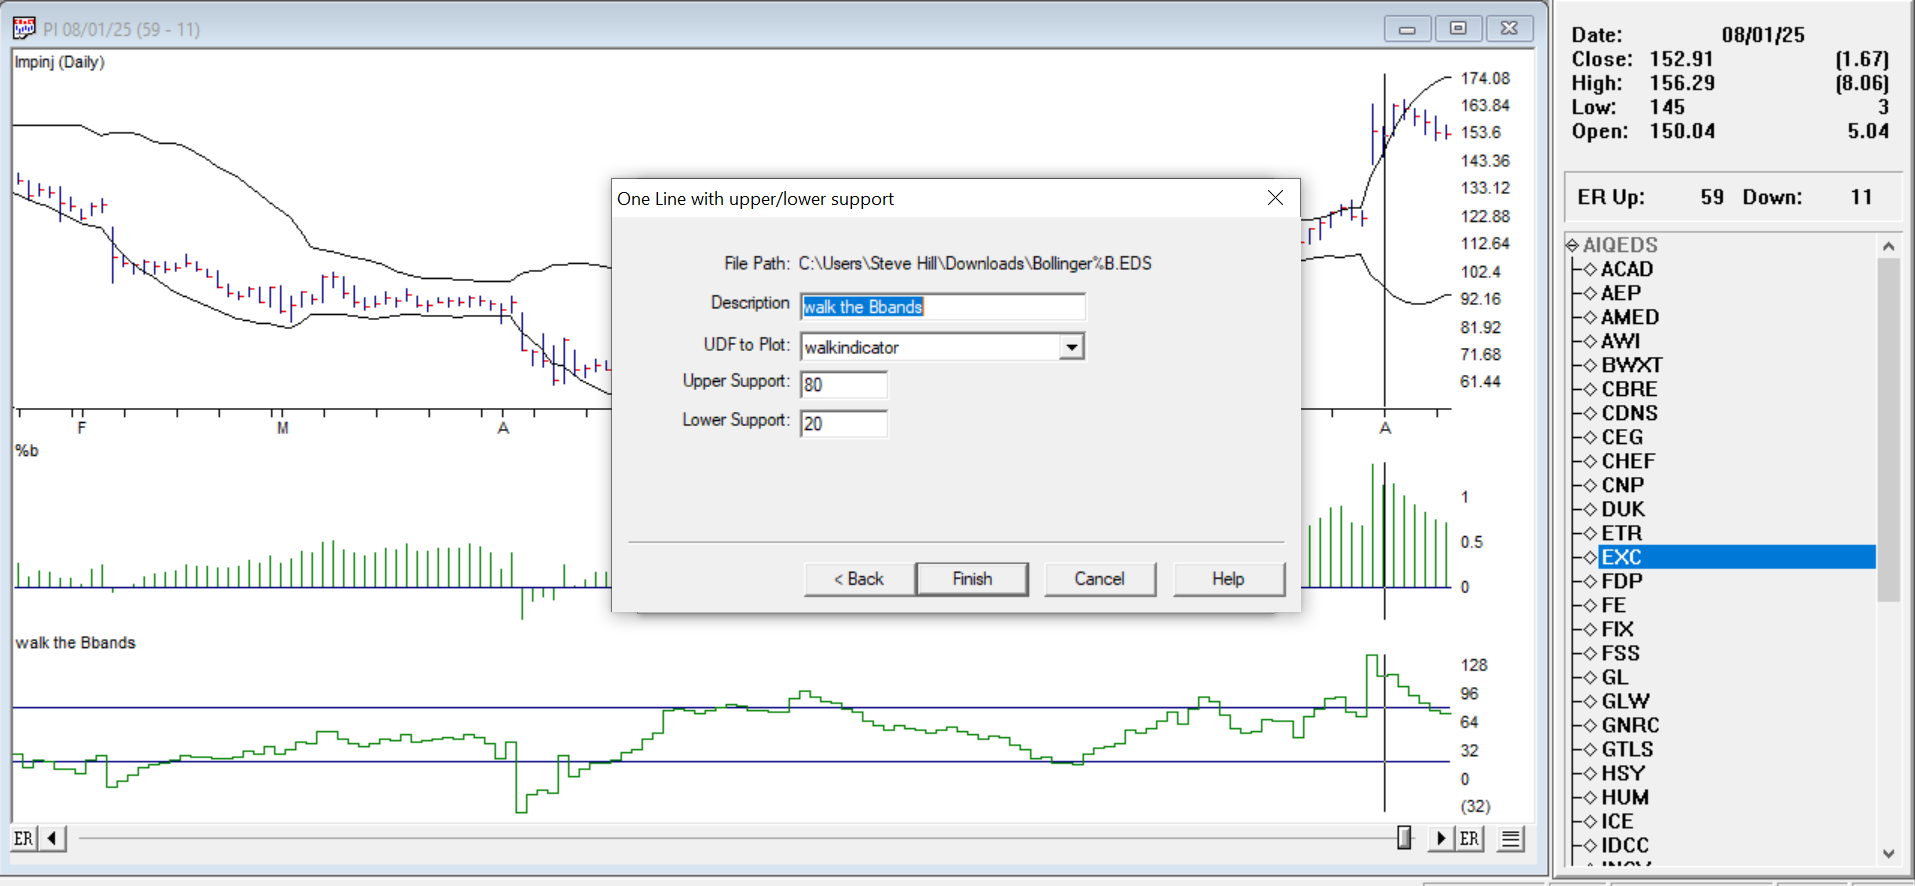
Give it a Description/Name, then choose the UDF to Plot (Walkindicator) and select Upper Support 80, Lower Support 20.
Click Finish, then Done. Your new indicator now appears in the Indicator Library and can be added to charts like any other study.
Final Thoughts
%B adds mathematical precision to Bollinger Band analysis. Whether you’re hunting for reversals, breakouts, or just trying to understand volatility better, %B gives you an exact reading of the price’s location in the band structure.