ChartSmart

ChartSmart
Transform raw chart data into actionable trading insights with the definitive guide to 29 essential technical indicators
Limited Time Offer - Save $40!
Why ChartSmart?

29 Essential Indicators
Master every indicator from Moving Averages to Bollinger Bands, MACD to Stochastics - all explained in plain English.

Real Market Examples
40+ recent chart examples from 2025 showing exactly how each indicator performs in actual market conditions.

Actionable Strategies
Learn when to buy, when to sell, and how to combine indicators for stronger confirmation signals.

Optimal Settings
Generally accepted input values and parameter ranges for each indicator to get started quickly.

Avoid Common Errors
Learn the interpretation mistakes that cost traders money - and how to avoid them.

Trading Platform Ready
Apply these strategies across many trading platform with examples you can implement immediately.
Learn Proven Strategies
Master these powerful indicator combinations used by professional traders
Stochastic Oscillator - Overbought/Oversold Signals
Buy Signal: When Stochastic crosses above 20 from below (oversold zone), especially if accompanied by bullish price action.
Sell Signal: When Stochastic crosses below 80 from above (overbought zone), particularly when price shows weakness.
Pro Tip: Use the 14-period setting (SK-14, SD-3) for daily charts. Wait for the %K line to cross above the %D line in oversold territory for stronger confirmation.
MACD - Trend Following & Divergence
Buy Signal: MACD line crosses above signal line while both are below zero, or bullish divergence (price makes lower low, MACD makes higher low).
Sell Signal: MACD line crosses below signal line while both are above zero, or bearish divergence (price makes higher high, MACD makes lower high).
Pro Tip: Standard settings (12, 26, 9) work well for daily charts. The histogram expanding shows trend acceleration—watch for histogram contraction as an early warning of trend exhaustion.
Volume + Price Action - Confirmation Strategy
Buy Signal: Volume spike on price breakout above resistance—shows institutional accumulation and confirms the move.
Sell Signal: High volume on breakdown below support, or declining volume during rally (distribution phase).
Pro Tip: Use a 50-day moving average on volume. Spikes above 2x the average often mark significant turning points. Volume should expand in the direction of the trend.
Combining Stochastic + MACD - Power Setup
Buy Signal: Stochastic crosses above 20 (oversold) AND MACD crosses above signal line within 1-3 bars of each other.
Sell Signal: Stochastic crosses below 80 (overbought) AND MACD crosses below signal line within 1-3 bars.
Pro Tip: This dual confirmation reduces false signals dramatically. When both indicators align, the probability of a sustained move increases by 60-70% compared to single indicator signals.
Bollinger Bands - Volatility Breakouts
Buy Signal: Price touches lower band, then closes back inside with increasing volume. Or "squeeze" (bands tighten) followed by breakout above upper band.
Sell Signal: Price touches upper band, then closes back inside with volume. Or breakdown below lower band after squeeze.
Pro Tip: The "Bollinger Squeeze" (bands at narrowest width in 6 months) precedes explosive moves. Use 20-period bands with 2 standard deviations. 95% of price action should occur within the bands.
ZigZag - Identifying Swing Points
Buy Signal: ZigZag identifies higher swing lows in an uptrend. Buy near the new swing low with stop below the previous swing low.
Sell Signal: ZigZag shows lower swing highs in a downtrend. Sell near the new swing high with stop above the previous swing high.
Pro Tip: Use 5-8% threshold for daily charts to filter out noise. ZigZag helps identify Elliott Wave patterns and Fibonacci retracement levels by marking clear swing points.
Real chart examples from stocks like GOOGL, TSLA, AAPL, and more - all from 2025 market conditions
See Real Indicators in Action
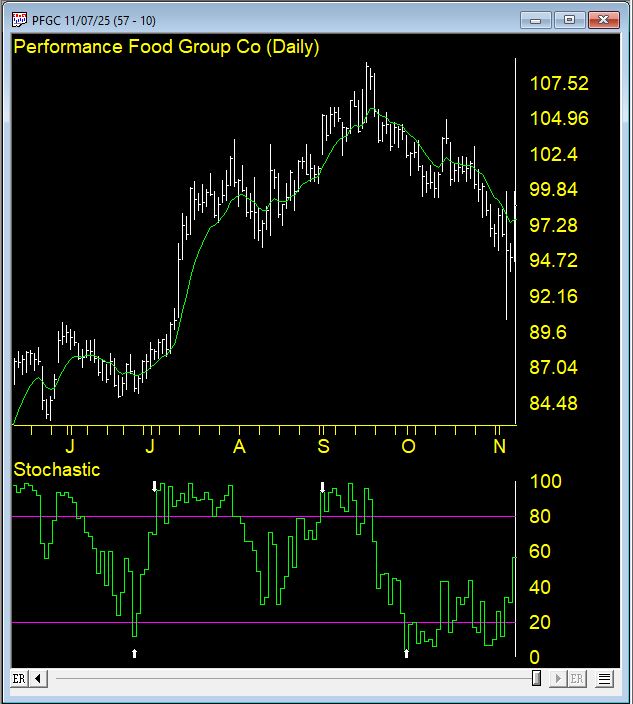
Performance Food Group - Identifying overbought/oversold conditions

Multiple indicator confirmation for stronger signals

Photronics Inc - Volume spike analysis at key price levels

Portfolio Recovery - Tracking accumulation/distribution
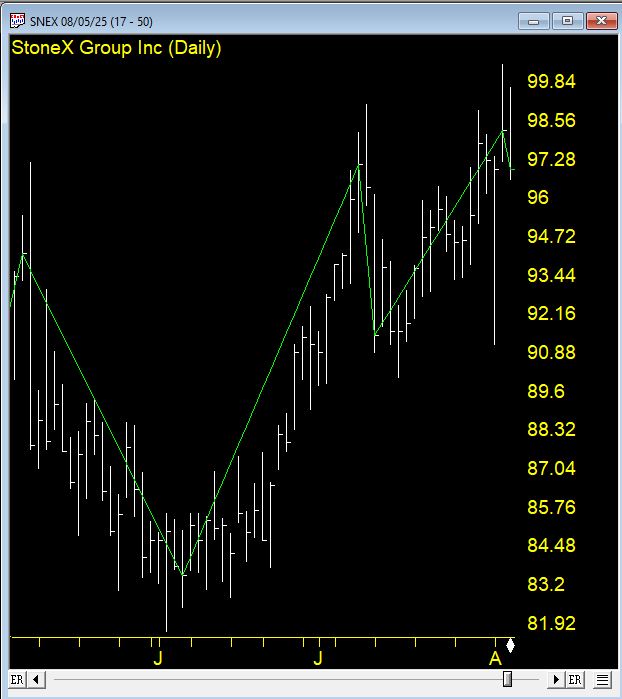
StoneX Group - Identifying significant price swings
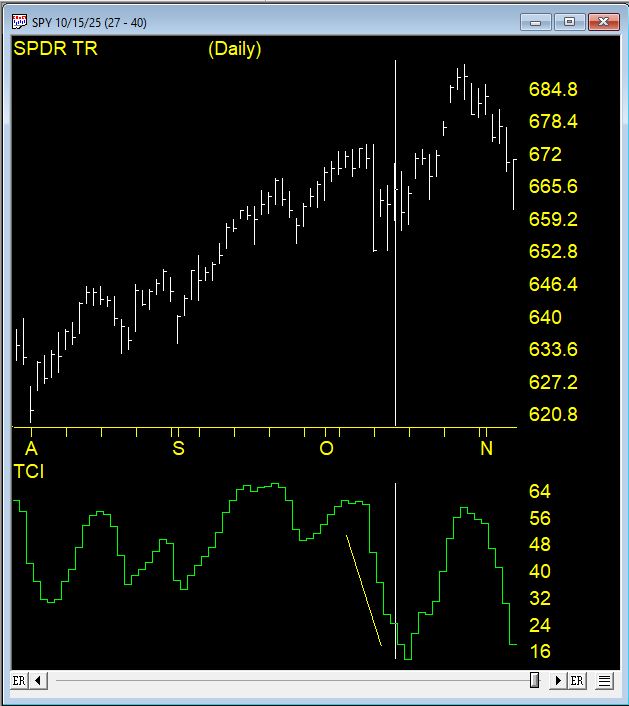
SPY - Measuring trend strength and potential reversals
Learn to spot divergences and non-confirmations that signal reversals
Understand consolidation patterns and volatility squeezes that precede big moves
Combine multiple indicators for high-probability entry and exit points
Replace intuition with insight backed by proven technical analysis
Every Indicator You Need
 21-Day High/Low Accumulation/Distribution Advance/Decline Indicators
 ADX & ADX Rate Bollinger Bands
 Commodity Channel Index
 Exponential Moving Averages Moving Averages (Simple)
 MACD
MACD Parabolic SAR
 Stochastics (SK-SD)
 Volume Indicators
 Trading Bands
 Volume Oscillator
 Velocity
 Volatility Indicator
 ZigZag
Start Trading Smarter Today
Join traders who've transformed their approach with ChartSmart
Holiday Sale - Ends Soon!