Seasonal Examples in TradingExpert Pro
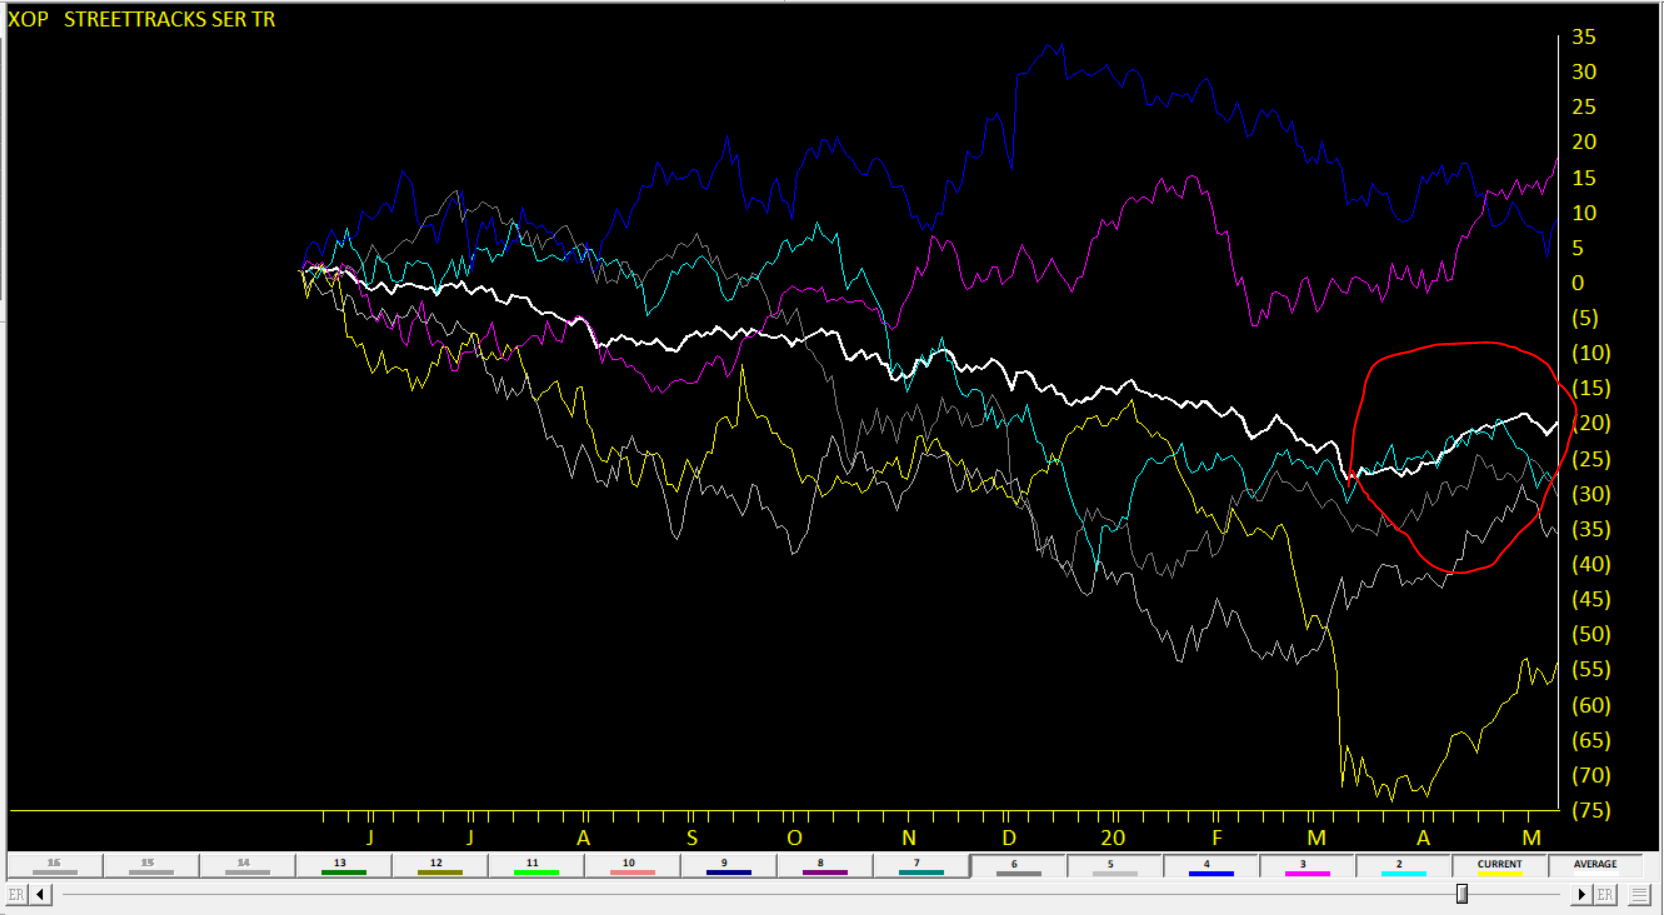
SPDR S&P Oil & Gas Exploration & Production ETF (XOP) Seasonal Chart 2015 - 2020
- While the pundits show the sweet seasonal period for XOP would be end of January through May 8. Our seasonal chart of 6 prior years of data shows all but one year, the bullish period was early March through May 8.
- The white line is the average of last 6 years trading on XOP
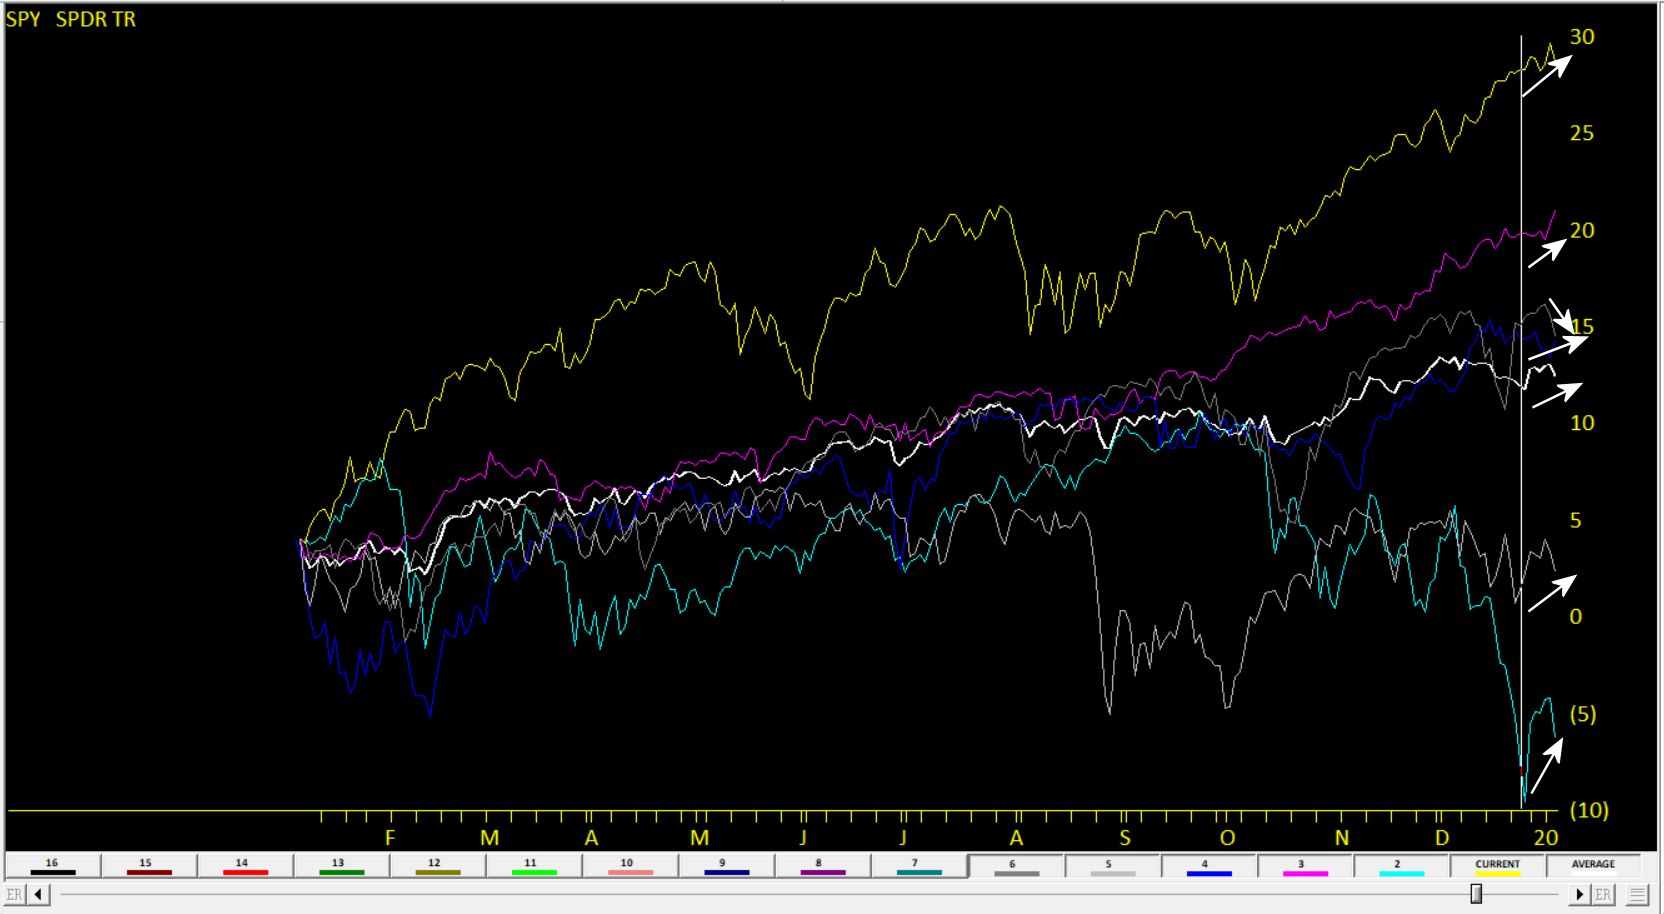
SPDR S&P 500 Seasonal Chart 2015 - 2020 Santa Claus rally
- Last 5 trading days of the year followed by the first 2 trading days of the next year is generally accepted be the rally.
- All but one of the last 5 years had a rally of some degree. The average line is in white.