Category Archives: matchmaker

Beating the Bond Market

Suddenly everyone is once again singing the praises of long-term treasuries.  And on the face of it, why not?  With interest rates seemingly headed to negative whatever, a pure play on interest rates (with “no credit risk” – which I still find ironic since t-bonds are issued by essentially the most heavily indebted entity in history – the U.S. government) stands to perform pretty darn well. 

EDITORS NOTE: We combined Jay's 2 articles on Beating the Bond Market into one article. Later in the article Jay uses AIQ TradingExpert Matchmaker tool to reveal that convertible bonds and high yield corporates have a much higher correlation to the stock market than they do to the long-term treasury. 

But is it really the best play?

Long-Term Treasuries vs. “Others”

Because a later test will use the Bloomberg Barclays Convertible Bond Index, and because that index starts in 1986 and because I want to compare “apples” to “apples”, Figure 1 displays the growth of $1,000 since 1986 using monthly total return data for the Bloomberg Barclays Treasury Long Index.

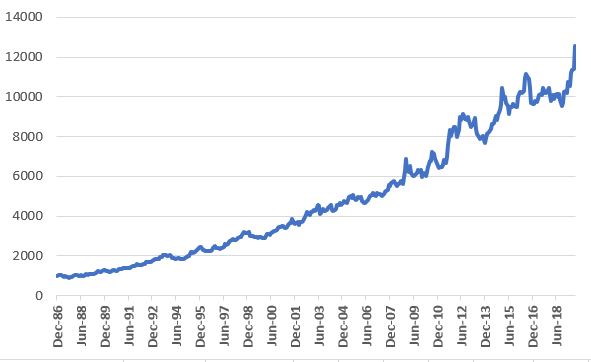
Figure 1 – Growth of $1,000 in Long-Term Treasuries (1987-2019)

For the record:

Ave. 12 mo %+8.2%
Std. Deviation+9.0%
Max Drawdown(-15.9%)
$1,000 becomes$12,583

Figure 2 – Bloomberg Barclays Treasury Long Index (Jan 1987-Jul 2019)

Not bad, apparently – if your focus is return and you don’t mind some volatility and you have no fear of interest rates ever rising again.

A Broader Approach

Now let’s consider an approach that puts 25% into the four bond indexes below and rebalances every Jan. 1:

*Bloomberg Barclay’s Convertible Bond Index

*Bloomberg Barclays High Yield Very Liquid Index

*Bloomberg Barclays Treasury Long Index

*Bloomberg Barclay’s Intermediate Index

Figure 3 displays the growth of this “index” versus buying and holding long-term treasuries.

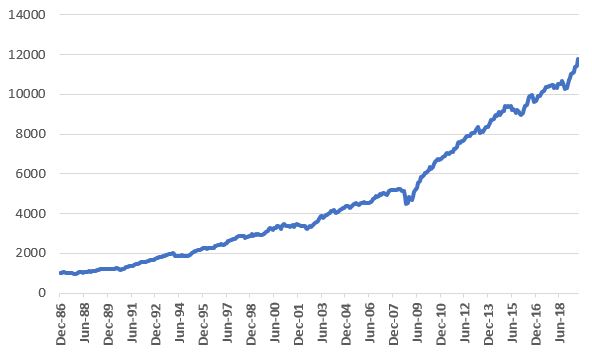
Figure 3 – Growth of $1,000 invested in 4-Bond Indexes and rebalanced annually; 1987-2019

Ave. 12 mo %+8.0%
Std. Deviation+6.8%
Max Drawdown(-14.8%)
$1,000 becomes$11,774

Figure 4 – 4-Bond Index Results; 1987-2019

As you can see, the 4-index approach:

*Is less volatile in nature (6.8% standard deviation versus 9.0% for long bonds)

*Had a slightly lower maximum drawdown

*And has generated almost as much gain as long-term treasuries alone (it actually had a slight lead over long-term treasuries prior to the rare +10% spurt in long treasuries in August 2019)

To get a better sense of the comparison, Figure 5 overlays Figures 1 and 3.

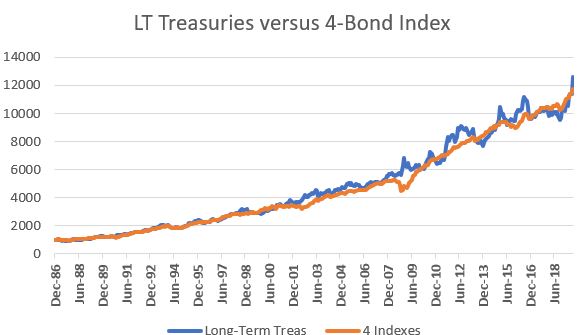
Figure 5 – Long Treasuries vs. 4-Bond Index

As you can see in Figure 5, in light of a long-term bull market for bonds, at times long-term treasuries have led and at other times they have trailed our 4-Bond Index.  After the huge August 2019 spike for long-term treasuries, they are back in the lead.  But for now, the point is that the 4-Bond Index performs roughly as well with a great deal less volatility.

To emphasize this (in a possibly slightly confusing kind of way), Figure 6 shows the drawdowns for long treasuries in blue and drawdowns for the 4-Bond Index in orange.  While the orange line did have one severe “spike” down (during the financial panic of 2008), clearly when trouble hits the bond market, long-term treasuries tend to decline more than the 4-Bond Index.

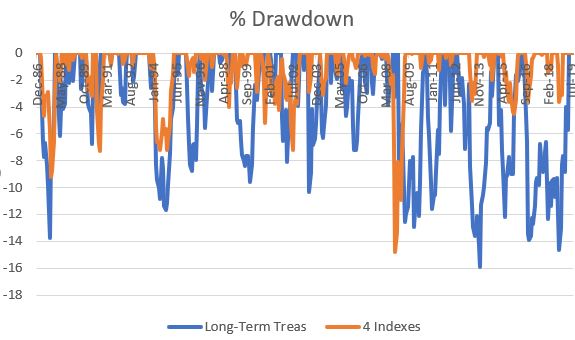
Figure 6 – % Drawdowns for Long-term treasuries (blue) versus 4-Bond Index (orange); 1987-2019

Summary

Long-term treasuries are the “purest interest rate play” available.  If rates fall then long-term treasuries will typically outperform most other types of bonds.  On the flip side, if interest rates rise long-term treasuries will typically underperform most other types of bonds.

Is this 4-index approach the “be all, end all” of bond investing?  Is it even superior to the simpler approach of just holding long-term bonds?

Not necessarily.  But there appears to be a better way to use these four indexes – which I will get to below

So, all-in-all the 4-bond index seems like a “nice alternative” to holding long-term treasuries.  But the title of these articles says “Beating the Bond Market” and not “Interesting Alternatives that do Just about as Well as Long-Term Treasuries” (which – let’s face it – would NOT be a very compelling title).  So, let’s dig a little deeper.  In order to dig a little deeper, we must first “go off on a little tangent.”

Bonds versus Stocks

In a nutshell, individual convertible bonds and high yield corporate bonds are tied to the fortunes of the companies that issue them.  This also means that as an asset class, their performance is tied to the economy and the business environment in general.  If times are tough for corporations it only makes sense that convertible bonds and high yield bonds will also have a tougher time of it.  As such it is important to note that convertible bonds and high yield corporates have a much higher correlation to the stock market than they do to the long-term treasury.

In Figures 1 and 2 we use the following ETF tickers:

CWB – as a proxy for convertible bonds

HYG – As a proxy for high-yield corporates

TLT – As a proxy for long-term treasuries

IEI – As a proxy for short-term treasuries

SPX – As a proxy for the overall stock market

BND – As a proxy for the overall bond market

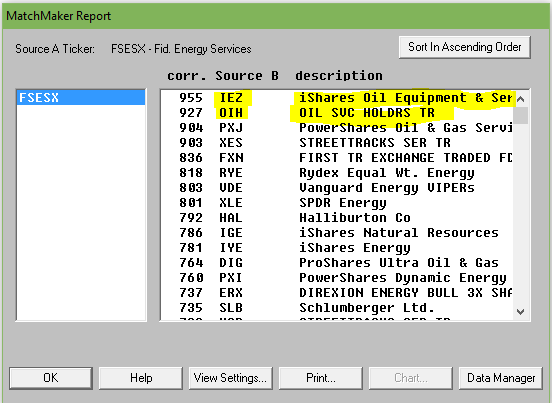
As you can see in Figure 1, convertible bonds (CWB) and high-yield corporates (HYG) have a much higher correlation to the stock market (SPX) than to the bond market (BND).

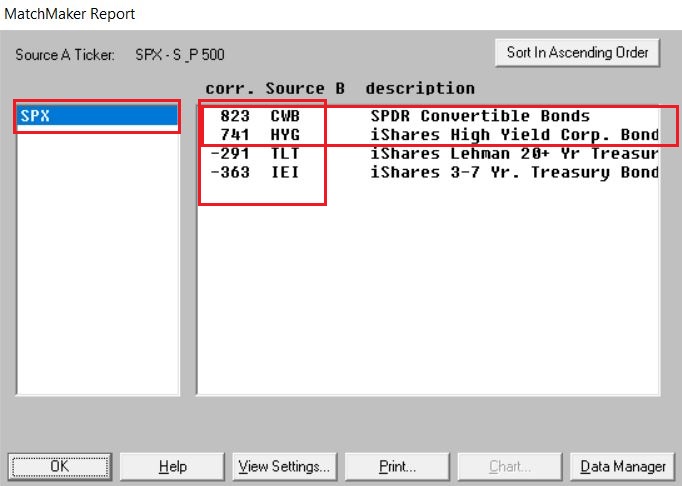
Figure 1 – 4-Bond Index Components correlation to the S&P 500 Index (Courtesy AIQ TradingExpert)

As you can see in Figure 2, long-term treasuries (TLT) and intermediate-term treasuries (IEI) have a much higher correlation to the bond market (BND) than to the stock market (SPX).

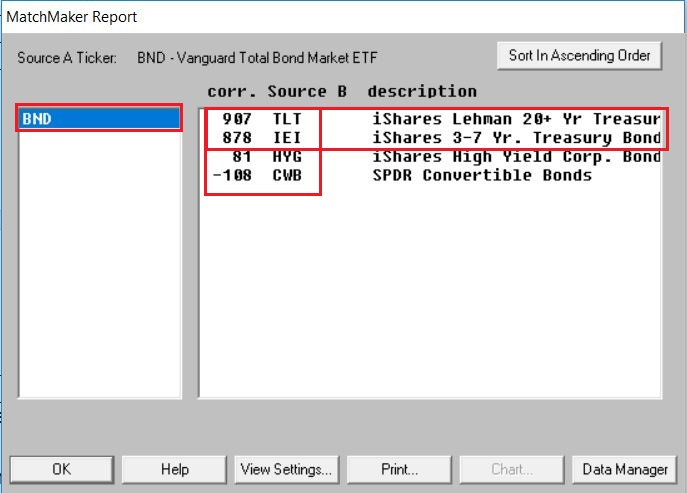
Figure 2 – 4-Bond Index Components correlation to Vanguard Total Bond Market ETF (Courtesy AIQ TradingExpert)

A Slight Detour

Figure 3 displays the cumulative price change for the S&P 500 Index during the months of November through April starting in 1949 (+8,881%)

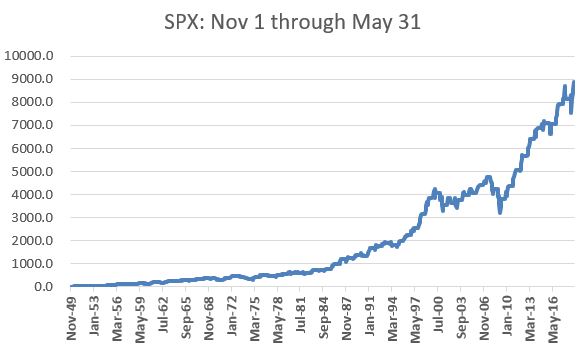
Figure 3 – Cumulative % price gain for S&P 500 Index during November through April (+8,881%); 1949-2019

Figure 4 displays the cumulative price change for the S&P 500 Index during the months of June through October starting in 1949 (+91%)

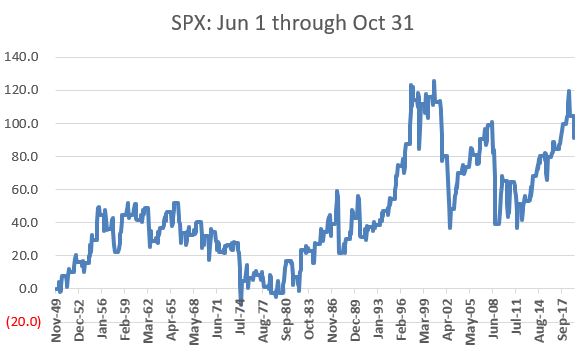
Figure 4 – Cumulative % price gain for S&P 500 Index during June through October (+91%); 1949-2019

The Theory: Parts 1 and 2

Part 1: The stock market performs better during November through April than during May through October

Part 2: Convertible bonds and high-grade corporate bonds are more highly correlated to stocks than long and intermediate-term treasuries

Therefore, we can hypothesize that over time convertible and high-yield bonds will perform better during November through April and that long and intermediate-term treasuries will perform better during May through October. 

Jay’s Seasonal Bond System

During the months of November through April we will hold:

*Bloomberg Barclay’s Convertible Bond Index

*Bloomberg Barclays High Yield Very Liquid Index

During the months of May through October we will hold:

*Bloomberg Barclays Treasury Long Index

*Bloomberg Barclay’s Intermediate Index

(NOTE: While this article constitutes a “hypothetical test” and not a trading recommendation, just to cover the bases, an investor could emulate this strategy by holding tickers CWB and HYG (or ticker JNK) November through April and tickers TLT and IEI May through October.)

Figure 5 displays the growth of $1,000 invested using this Seasonal System (blue line) versus simply splitting money 25% into each index and then rebalancing on January 1st of each year (orange line).

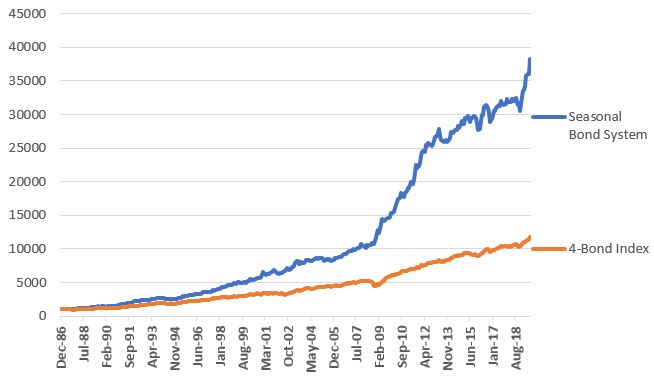
Figure 5 – Growth of $1,000 invested using Jay’s Seasonal System versus Buying-and-Holding and rebalancing (1986-2019)

Figure 6 displays some comparative performance figures.

MeasureSeasonal System4 Indexes
Buy/Hold/Rebalance
Average 12 month % +(-)+11.9%+8.0%
Std. Deviation %8.7%6.8%
Ave/StdDev1.371.18
Max Drawdown%(-9.2%)(-14.8%)
$1,000 becomes$38,289$11,774

Figure 6 – Seasonal Strategy versus Buy/Hold/Rebalance

From 12/31/1986 through 8/31/2019 the Seasonal System gained +3,729% versus +1,077% (3.46 times as much) as the buy/hold and rebalance method.

Summary

The Seasonal Bond System has certain unique risks.  Most notably if the stock market tanks between November 1 and April 30, this system has no “standard” bond positions to potentially offset some of the stock market related decline that convertible and high yield bonds would likely experience. Likewise, if interest rates rise between April 30 and October 31st, this strategy is almost certain to lose value during that period as it holds only interest-rate sensitive treasuries during that time.

The caveats above aside, the fact remains that over the past 3+ decades this hypothetical portfolio gained almost 3.5 times that of a buy-and-hold approach.

Question: Is this any way to trade the bond market?

Answer: Well, it’s one way….

Jay Kaeppel

Disclaimer:  The data presented herein were obtained from various third-party sources.  While I believe the data to be reliable, no representation is made as to, and no responsibility, warranty or liability is accepted for the accuracy or completeness of such information.  The information, opinions and ideas expressed herein are for informational and educational purposes only and do not constitute and should not be construed as investment advice, an advertisement or offering of investment advisory services, or an offer to sell or a solicitation to buy any security.

MatchMaking a seasonal Energy play

If you follow jay Kaeppel’s posts in this blog, you’ll know that he’s the master of research on all things seasonal. This past week he posted a seasonal article on energy using FSESX – Fidelity Select Energy Services. Previously he had noted the bullish tendency for ticker FSESX during the months of February, March and April.  In his follow up piece, he added one more “favorable” month and then also looked at a 6-month “unfavorable” period. The article is included at the end of this post so you can see the results.

As Mutual funds are not for everyone, we went in search of alternative tickers that could closely match FSESX in performance characteristics. Using AIQ Matchmaker we compared the price action of FSESX against our universe of stocks and ETFs looking for a match.

Matchmaker uses Spearman Rank Correlation analysis to identify a close match to FSESX. The closer the result to 1000, the higher the correlation. Anything over 950 is a very close match. Here’s the results.
Figure 1. MatchMaker correlation for last 4 years – FSESX vs stocks and ETFs
The ETF IEZ – iShares Oil and Equipment & Services showed a very high correlation over the 4 years we tested. OIH – Oil Service Holders, another ETF, also showed high correlation.
Here’s an AIQ overlay chart of recent daily price action comparing FSESX vs IEZ.
 
Figure 2. Recent daily price action comparing FSESX vs IEZ.
IEZ appears to be a good surrogate for FSESX at least over the last 4 years.
We also wanted a visual of the seasonal pattern in action. Fortunately we have a tool still in development at AIQ that’s just right for this. Basically it provides a price comparison of ‘x’ numbers of years of the same ticker overlaid on each other.
Here’s 3 of the last 4 years on IEZ, the average of the years displayed is in black. We highlighted the Feb, Mar, Apr and Dec in yellow. We could have included more years but for illustration purposes it was easier to show the 3 years (the chart gets busy with too many lines on it!)
 
Figure 3 – IEZ seasonal chart (beta) for 3 years with average.
The Feb, Mar, Apr period has a definite bullish tendency, the Dec period does Ok too. You’ll notice the tendency for IEZ to fall sharply in January. Conclusion? IEZ is a reasonable surrogate for FSESX if you’re contemplating this seasonal move.
_________________________________________________________
The article this follow up is based upon is by Jay Kaeppel and is included below. Jay is Chief Market Analyst at JayOnTheMarkets.com and AIQ TradingExpert Pro client. http://jayonthemarkets.com/

When to Feel ‘Energetic’ (or NOT)

If you are looking for a market sector with some serious seasonal trends, look no further than the energy sector. Previously I had noted the bullish tendency for ticker FSESX during the months of February, March and April.  In this piece, we will add one more “favorable” month and then also look at a 6-month “unfavorable” period.
For the record, the information that follows is not being recommended as a standalone strategy.  It is presented simply to make you aware of certain long-term trends that have been very persistently bullish (or bearish as the case may be) in the energy sector.
4 Favorable Months
*The four “favorable” months for our test are February, March, April and December
Figure 1 displays the growth of $1,000 invested in ticker FSESX only during these four months every year since 1986 versus simply buying-and-holding ticker FSESX.
1
Figure 1 – Growth of $1,000 invested in FSESX only during Feb, Mar, Apr, Dec every year since 1986
Starting in 1986, an initial $1,000 investment grew to $76,019 (or +7,500%) versus $10,237 (or 923%) using a buy-and-hold strategy.
6 Unfavorable Months
The six “Unfavorable” months are June, July, August, September, October and November.
First the “positive” news:
*This 6-month period has managed to show a gain 14 times in 31 years – so by no means should you consider this period a “sure thing” loser
*During 4 separate years – 1997, 2003, 2004 and 2010 – the “unfavorable” months registered a cumulative gain in excess of +30%.
Doesn’t sound all that “unfavorable” so far does it?  But here’s the catch: Despite the occasional 30%or more gain, it is fair to refer to this 6-month period as “unfavorable” as the cumulative long-term results of buying and holding FSESX during these months has been nothing short of devastating.
Figure 2 displays the growth of $1,000 invested in ticker FSESX only between the end of May and the end of November every year starting in 1986.
3
Figure 2 – Growth of $1,000 invested in FSESX only during June through November every year since 1986
Starting in 1986, an initial $1,000 investment declined to just $82, or a cumulative loss of -91.8%
Figure 3 displays some comparative data between favorable and unfavorable periods as well as using a Buy-and-Hold strategy.
Measure Buy-and-Hold 4 Favorable Months 6 Unfavorable Months
Average Annual % +(-) 12.8 16.5 (-4.2)
Median Annual % +(-) 8.7 15.5 (-1.8)
Standard Deviation 33.4 20.1 24.6
# Years UP 18 26 14
# Years DOWN 13 5 17
Worst Year (-55.4) 2008 (-7.6) 1994 (-62.8) 2008
$1,000 becomes $10,237 $76,019 $82
Cumulative % +(-) +923% +7,500% (-92%)
Figure 3 – Comparative Results
Figure 4 displays the year-to-year results for a Buy-and-Hold approach versus holding only during the 4 “favorable” months or the “Unfavorable” 6 months.
Year All 12 months % +(-) 4 Favorable % +(-) 6 Unfavorable % +(-)
1986 (8.9) (5.2) (9.2)
1987 (20.7) 22.9 (40.1)
1988 (4.2) 22.8 (16.3)
1989 50.3 27.1 16.2
1990 8.7 4.9 (11.2)
1991 (19.9) 4.1 (25.0)
1992 4.9 (1.6) (1.3)
1993 16.4 24.5 (10.7)
1994 (0.5) (7.6) 3.1
1995 40.0 33.7 2.0
1996 45.9 22.5 20.8
1997 43.9 (4.9) 32.9
1998 (41.4) 26.5 (50.5)
1999 80.9 74.1 7.5
2000 51.7 77.6 (21.1)
2001 (22.4) 20.8 (32.4)
2002 2.2 26.2 (18.0)
2003 13.1 15.5 (16.0)
2004 26.2 1.2 30.2
2005 47.4 4.8 34.0
2006 (9.1) (4.1) (1.8)
2007 58.3 25.6 16.7
2008 (55.4) 10.5 (62.8)
2009 60.4 24.5 9.6
2010 31.7 21.6 33.7
2011 (18.5) 3.1 (16.8)
2012 (3.9) 0.7 9.6
2013 14.1 0.3 11.5
2014 (19.5) 7.2 (26.7)
2015 (19.7) 2.9 (17.9)
2016 44.2 28.4 20.1
Figure 4 – Yearly % +(-) for Buy-and-Hold versus 4 Favorable Months versus 6 Unfavorable Months
Summary
There is no guarantee from year-to-year results of buying and holding ticker FSESX during the “Favorable 4” months will show a gain and/or outperform the “Unfavorable 6” months. And there is by no means any guarantee that the “Unfavorable 6” will show a loss during any given year (note that 2016 saw the Unfavorable 6 generate a cumulative gain of +20.1%!).  So just remember that we are talking about some very long-term  trends here.
Still, most investors can discern the difference between:
*Favorable 4 months gain = +7,500%
*Unfavorable 6 months loss = (-92%)
This type of difference is what we “quantitative types” refer to as “statistically significant.”

Why a fine-tuned Group/Sector structure is essential for identifying good trading opportunities

Index Methodology Overview

This paper was prepared to assist subscribers/investors with an understanding of the investment concepts behind the construction and use of the FATI® Sector/Group Index.


Key Concepts


Data Dependence

The investment world is more data dependent today than ever before. This applies to both technical or fundamental data. The individual stock universe is comprised of approximately 16,000 stocks, of which 8,000 have quasi-reliable technical and fundamental data available. Even a universe of 8,000 stocks is extremely large and very hard for any investor to manage.

One of the risks with large amounts of data, of any type, is its quality. If we use low quality data, it could create incorrect outputs used in your investment decision process. There is an old adage that applies here and most have heard it before: Garbage In – Garbage Out. The quality of data and the ability to manage this data is paramount in the investment management process.

Sector/Group Structure

Many of the available Sector/Group Indices have, what is called, ‘limited participation’. Some of the industries groups contain only one or two stocks. The FATI® Sector/ Group Index is designed to maximize the number of issues in each industry group. For example, a major index provider has an index with 60 industries and an average of 8.3 stocks per industry. If you look closely you will find over 10% of the industries are comprised of only one or two stocks. Hardly a representative sample. The FATI® Sector/Group Index averages over 44 stocks per industry and no less than 6-7 stocks on average in an industry group. This gives investors a more accurate representation of each industry. The index also broadens the number of sectors from the industry average of 10 to 17 sectors. This was done to improve the granularity of the index and make it easy to identify investment opportunities.

Influential Factors on the Markets

It is a well-known fact approximately 90% of the volume in the equity markets come from institutional investors. These investors include mutual funds, pension plans, insurance companies and hedge funds Due to the large size of the portfolios they manage, it may take weeks, if not months; for them to build a position in a stock. Remember, these investors try to buy or sell in a stealth manner to avoid tipping their actions and having the price pushed up or down before they have finished acquiring or disposing a position.

Since institutional investors have such a significant influence on the market, it only makes sense to focus on the stocks they watch and trade. We conducted a poll to determine if there were a common, and simple, set of criterion which could be used to narrow a list of over 8,000 stocks. At the same time, try to determine what the average investment manager’s universe of stocks is comprised of. Institutional analyst’s standards are high when it comes data requirements. If those standards are missing from the data of a company, they won’t consider the company for investment potential. Remember Data Dependence from above. ‘Garbage In – Garbage Out’.

The Search


The Poll and Results

The poll was conducted from a random list of investment managers. Armed with the data collected from the investment managers a plethora of test screenings were performed. Each screening was reviewed to determine the data available, data completeness and data quality, both fundamental and technical. After exhaustive testing, a final list of criterion was selected. The final screening using the selected criterion was performed and compared to several investment manager’s universe of stocks. The results showed, on average, the final screen captured 86% of their universe of stocks. Some higher some lower.

Below is the final criterion used in the construction of the FATI® Sector/Group Index.

  • Average Daily Trading Volume >= 100,000 shares
  • Current Price >= $5.00
  • Number of Analysts in Average Broker Rating >= 2
  • Market Cap Valuation >= $100 million

The index is updated once a month using the criterion listed above. In any given month as many as 20-300 stocks may be added and/or deleted from the index. The number of issues in the index has ranged between 2,500-3,000 stocks. By narrowing the number of stocks in this manner, the fundamental and technical data was more plentiful, more accurate and more complete.

Putting it All Together

Knowing the key concepts and the criterion used in the construction of the FATI® Sector/Group Index, let’s put it all together and answer the question.

Why Use the FATI® Sector/Group Index?”

The index provides investors with:

1. a list of stocks institutional investors watch and trade.
2. a higher quality Sector/Group structure for better investment decisions.
3. market capitalizations ranging from Mega Caps to Nano Caps.
4. the elimination of low priced / low quality stocks with poor quality data.
5. simple maintenance of the index and fundamental data. Download and Use.


One Last Thought

There are two generally accepted approaches to investing. Fundamental and Technical. Which is better is not up for debate here, but instead consider the following;

Fact, the majority of institutional investors purchase companies based upon strong fundamentals and earnings.

Professional Traders focus on technical indicators, patterns and news events to determine when to buy or sell a stock.


Why choose between two methodologies?

Don’t, use both.

First, use the FATI® Sector/Group Index to focus on the stocks institutional investors are watching and trading. Next, screen for companies in the Index with strong fundamentals and earnings. Lastly, use technical analysis to determine when to buy or sell the fundamentally screened stocks.


FATI® Sector/Group Index
+
Fundamental Data
+
Technical Analysis
=
MORE PROFITS


Find out how you can add FATI® Sector/Group Index + Fundamentals  to your trading arsenal

or call sales at  1-800-332-2999